Tools Assessing Performance for Distributed Wind
Tools Assessing Performance (TAP) seeks to improve distributed wind resource assessments using modern computational tools and data.
TAP aims to develop a simple tool for cost-effectively and accurately assessing wind resources without having to physically take direct measurements in the field. Improving the accuracy and reducing the cost of desktop, or virtual, wind resource assessments will help make distributed wind energy technologies more accessible to communities and businesses seeking to transition to carbon-free electricity resources.
TAP is a multilaboratory project funded by the U.S. Department of Energy’s Wind Energy Technologies Office, led by NREL, and supported by Argonne National Laboratory, Los Alamos National Laboratory, and Pacific Northwest National Laboratory.
TAP collaborators and advisors include members of the government, the wind energy industry, and academia. Throughout the project, these have included the U.S. Department of Energy, EAZ Wind, Bergey Wind Power, the Distributed Wind Energy Association, the New York State Energy Research and Development Authority, mCloud, Buffalo Renewables, Texas Tech University, University of Wyoming, University of Illinois Urbana-Champaign, and University of Colorado Boulder, and project partners helping to identify and minimize the risks and uncertainties in wind power plant operation and profitability.
Key Initiatives
The following initiatives are the key priorities of the TAP project.
National Wind Resource Modeling
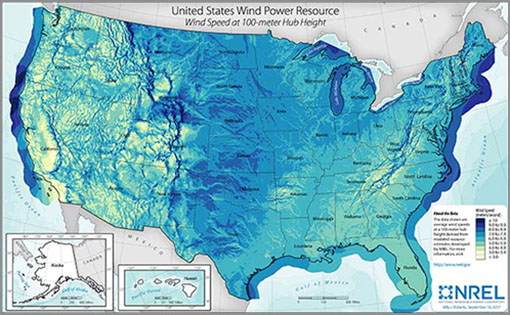
The TAP team is developing a new national wind resource data set called the Wind Integration National Dataset Toolkit Long-Term Ensemble Dataset. The data set provides high-resolution (in terms of both time and space) land-based and offshore wind potential for the entire United States.
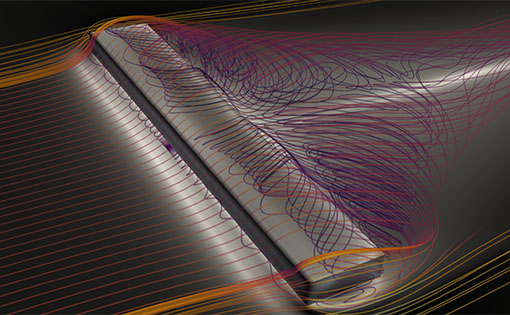
Wind Models With Obstacles
The TAP team is developing fast-running obstacle models built from modern artificial intelligence and complex flow modeling.

Data and Computational Tools
The TAP project offers data access and streamlined tool integration through two user-friendly pathways: the TAP application programming interface (better known as API) and other third-party tools, such as NREL's System Advisor Model.
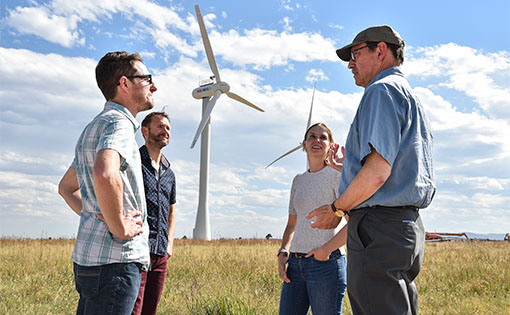
Stakeholder Engagement
The project works with wind turbine manufacturers, installers, and owners to ensure that the tool effectively serves their needs by eliciting feedback on key features of the TAP capability. Feedback is gained through one-on-one conversations, targeted workshops, and post-presentation discussions at conferences.
Capabilities
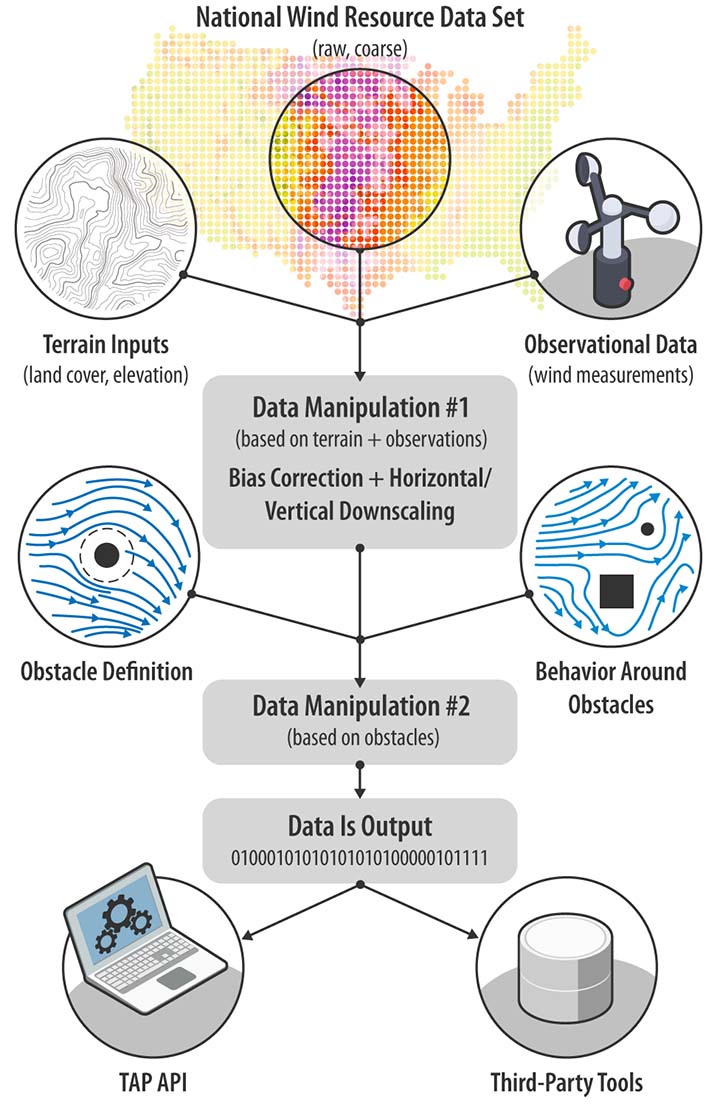
To produce a wind resource estimate, the TAP tool first combines terrain inputs (such as land cover and elevation data) with the National Wind Resource Dataset (which is somewhat raw and course) and observational data (wind measurements). TAP performs a first pass of data manipulation based on geographic information systems and observations. Then it corrects for bias and downscales, horizontally/vertically. Those results, paired with information about the behavior of wind around obstacles, feed into a second data manipulation. The final data is incorporated into the TAP API, accessible by third-party tools.
The following tools and data were developed as part of the TAP project to better enable distributed wind resource assessments.
WIND Toolkit Long-Term Ensemble Dataset
The Wind Integration National Dataset Toolkit Long-Term Ensemble Dataset, developed by researchers at NREL, Argonne National Laboratory, and the University of Wyoming, provides wind resource data for the entire continental United States, Hawaii, and Alaska for 20 years (2001–2020). The data set is high resolution and covers above-ground heights from 10 to 1000 meters in 2- and 4-kilometer grids at 5-minute and 1-hour temporal resolutions.
Obstacle and Observation Data
The TAP team collected and quality controlled observational wind data from thousands of meteorological towers, airport weather stations, and a network of weather monitoring sites across the United States, as well as the Isolated Building Wake Experiment field campaign conducted by Los Alamos National Laboratory at the Texas Tech Wind Engineering Research Field Laboratory site. Data comes from dozens of sonic anemometers that measure the wake behind a rotatable rectangular building. These data sets are available on the U.S. Department of Energy’s Atmosphere to Electrons TAP page.
Obstacle Models
Researchers at Argonne National Laboratory and Los Alamos National Laboratory developed low-fidelity obstacle models that can be leveraged through the TAP API to evaluate trees and buildings that surround potential wind turbine sites.
Tap Application Programming Interface
The TAP API, developed by researchers at NREL, allows users to access the full-featured TAP computational pipeline. Using the linked API, users can download wind resource data at specified locations and heights, estimated using the computational pipeline and customized based on specified control parameters (e.g., with or without obstacles). Users will be able to download time-series data or summary statistics based on the 20-year wind resource data set.
TAP User Interface
The TAP user interface (known as a UI) is a graphical UI that allows users to select and zoom into their sites of interest on a map and click on the desired locations to view visualizations of the wind rose and selected summary statistics.
Publications
Validation of Wind Resource and Energy Production Simulations for Small Wind Turbines in the United States, Wind Energy Science (2022)
Evaluation of Obstacle Modelling Approaches for Resource Assessment and Small Wind Turbine Siting: Case Study in the Northern Netherlands, Wind Energy Science (2022)
Bias Characterization, Vertical Interpolation, and Horizontal Interpolation for Distributed Wind Siting Using Mesoscale Wind Resource Estimates, NREL Technical Report (2021)
DW TAP Computational Framework, Software (2020)
A Physics-Informed Data-Driven Low Order Model for the Wind Velocity Deficit at the Wake of Isolated Buildings, Argonne Technical Report (2021)
Learn more about the project via the TAP Fact Sheet and download a list of TAP-related publications last updated September 2022.
Contact
Share
