Bioenergy Sustainability Analysis
NREL's bioenergy sustainability analysis group works with researchers around the world through global multilateral collaborations to assess bioenergy and bioeconomy developments in multiple scientific and social fields.
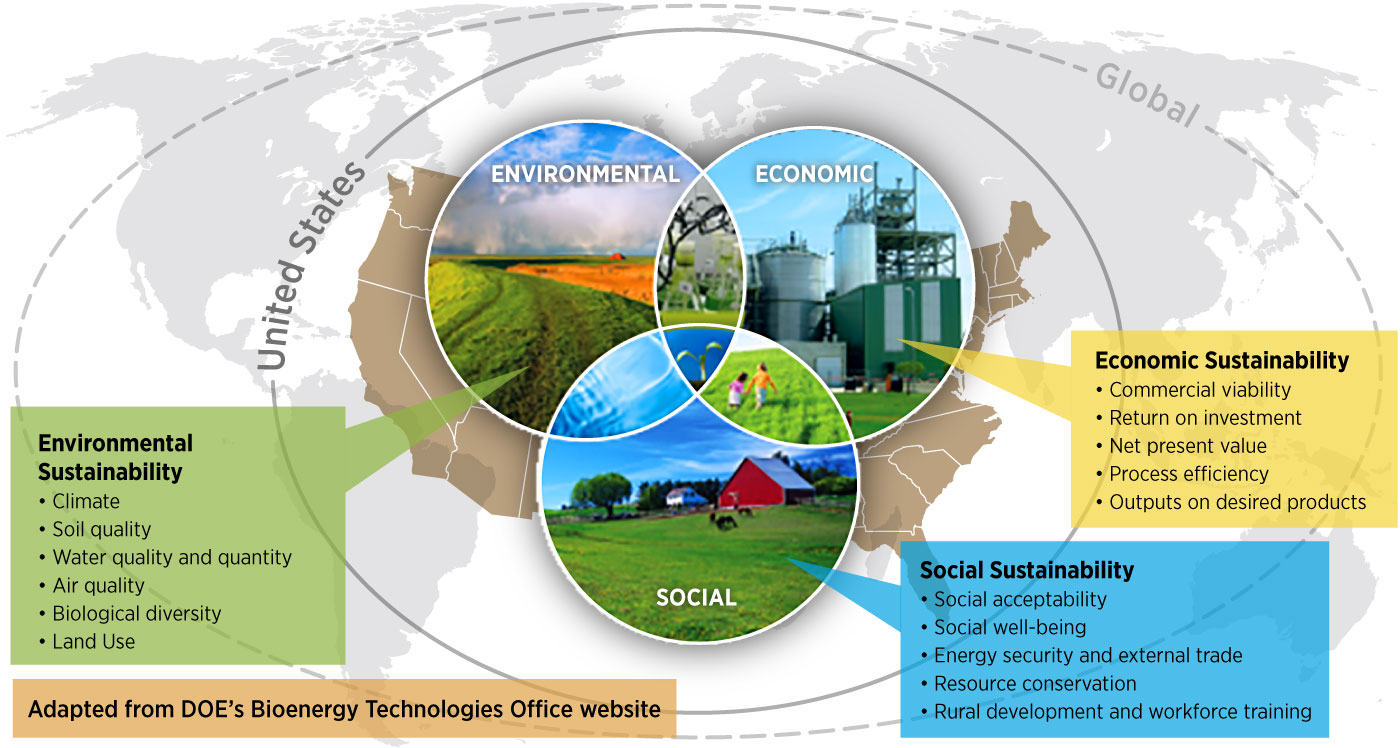
We assess and synthesize developments as the science and technologies of biomass conversion and their systems mature. We aim to understand economic, environmental, and social aspects as these systems evolve and develop best practices. We also use advanced analytical tools and methodologies and perform systematic studies to understand how to bridge the gaps between bioenergy and integrated biomass systems and global sustainability.
NREL does this in partnership with the U.S. Department of Energy Bioenergy Technologies Office Sustainability Program and its performing organizations.
Featured Publications
Chapter 1: Technical Summary, Chapter 2: Bioenergy Numbers, Chapter 6: Sustainable Development and Innovation, Chapter 9: Land and Bioenergy, Chapter 12: Conversion Technologies for Biofuels and Their Use, and Chapter 20: Bioenergy Economics and Policies, Bioenergy and Sustainability: Bridging the Gaps (2015)
A Global Survey of Stakeholder Views and Experiences for Systems Needed to Effectively and Efficiently Govern Sustainability of Bioenergy, WIREs Energy and Environment (2015)
Chapter 7: Energy Systems, Chapter 8: Transport, and Chapter 11: Agriculture, Forestry and Other Land Use, Climate Change 2014: Mitigation of Climate Change (Working Group III Fifth Assessment Report) (2014)
Bioenergy and Climate Change Mitigation: An Assessment, GCB Bioenergy (2014)
Understanding the Evolution of Environmental and Energy Performance of the U.S. Corn Ethanol Industry: Evaluation of Selected Metrics, Biofuels, Bioproducts and Biorefining (2013)
View all NREL bioenergy sustainability analysis publications.
Capabilities
Analysis of Global Systems
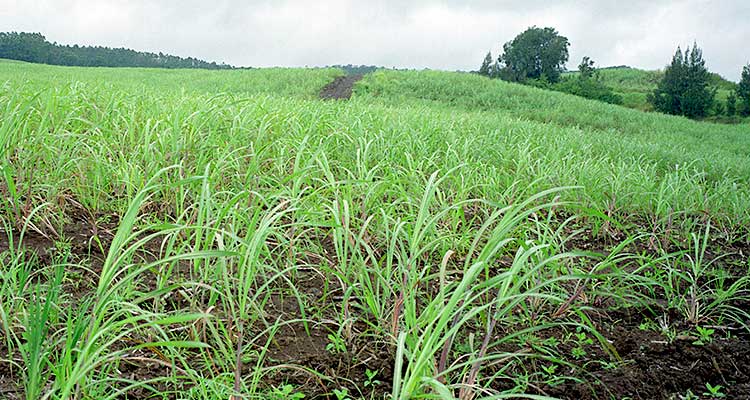
The world of biomass is complex and biomass resources vary around the world. We study the relationship of land types and their use in agricultural and forestry systems and in manufacturing. Products from these interconnected systems are consumed and generate waste and residues that are landfilled, with or without energy recovery, re-used in a cascade of uses, recycled into the same or different products, or used to produce energy.
We use statistical data that multiple government agencies from each country provide to the United Nations such as the Food and Agriculture Organization (collects data on food, feed, forestry, inputs, and emissions), the Framework Convention on Climate Change (inventories greenhouse gases per the Kyoto Protocol), and the Organization for Economic Cooperation and Development International Energy Agency (collects data on energy production and use in various sectors of the economy).
Greenhouse Gas Reductions
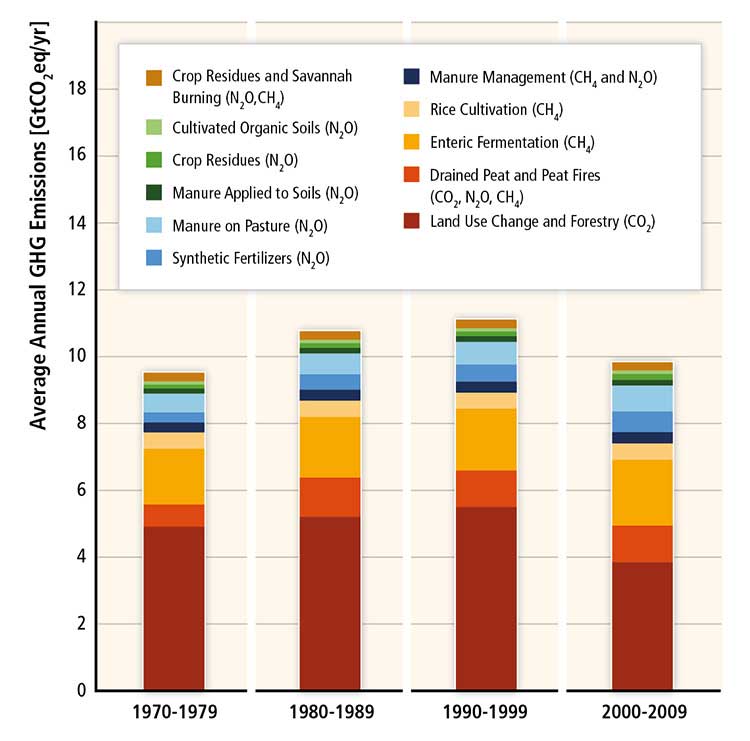
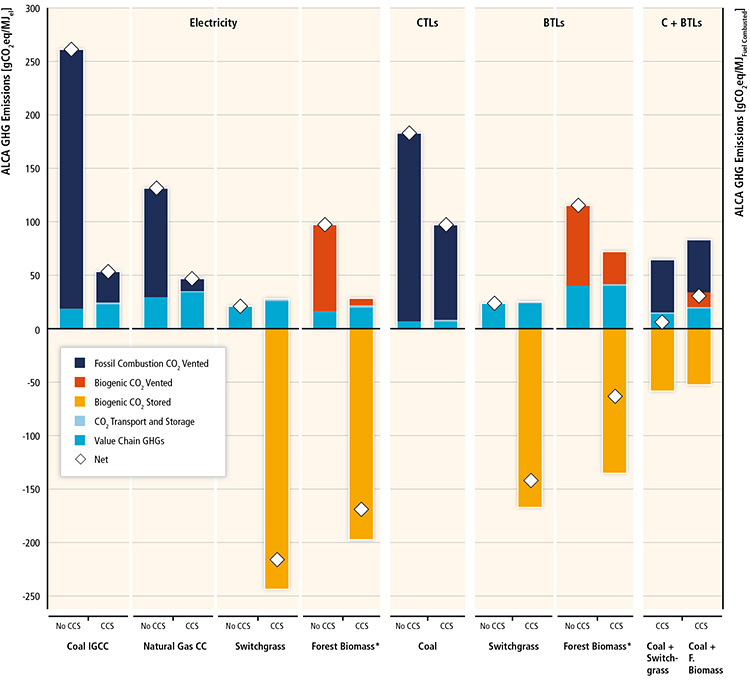
The system of agriculture, forestry, and other land use (AFOLU) was the only International Project of Climate Change (IPCC) sector whose greenhouse gas emissions decreased in the last decade according to the 5th Assessment Report of the IPCC. AFOLU emissions are the most difficult to quantify and have the highest uncertainties. The conservation of agricultural soils and afforestation have the potential to increase soil carbon sequestration and therefore further mitigate greenhouse gas (GHG) emissions. We are looking at what role bioenergy, including biochar, can play in climate change mitigation at a large scale since bioenergy coupled with carbon dioxide capture and storage (CCS) could provide negative emissions needed to reach levels of carbon dioxide in the atmosphere compatible with 2oC or less from pre-industrial levels. The role of biomass in electricity generation or fuels production using gasification technologies followed by CCS is illustrated below. Coal and natural gas can reduce emissions with CCS but sustainably produced biomass is necessary to sequester carbon dioxide quickly to offset fossil emissions. Research questions involve the sustainability of the overall systems.
Multiple Products
Biomass and bioenergy systems produce benefits and also impacts to air, water, and land locally, regionally, and globally, and many of them are diffuse. It is difficult to assign these impacts to bioenergy alone since these applications are part of agriculture, forestry, and management of rural and urban residues and wastes. Bioenergy applications include biomass for heating and cooking, electricity generation, and for combined heat/electricity in the power and pulp and paper industries, or in the production of liquid or gaseous fuels for transport or other large numbers of chemicals, materials, and special products currently made from fossil energy. The evolving bioeconomy aims to close these cycles of interconnected systems to optimize multiple economic, environmental, ecological, and social (e.g., jobs) of multiple resource use.
Research Team
Principal Investigators


Annika Eberle
Collaborators
Argonne National Laboratory The Greenhouse Gases, Regulated Emissions, and Energy Use in Transportation (GREET) Model
Argonne National Laboratory Water Analysis Tool for Energy Resources (WATER) and Water Footprint Accounting
Idaho National Laboratory Bioenergy Feedstock Library
Intergovernmental Panel on Climate Change
International Energy Association (IEA) Bioenergy: IEA Task 38, IEA Task 39, and IEA Task 43
Oak Ridge National Laboratory Center for BioEnergy Sustainability
Scientific Committee of Problems of the Environment (SCOPE) (leaders from the State of Sao Paulo Research Foundation and collaborators)
U.S. Department of Energy (DOE) Bioenergy Technologies Office (BETO) Sustainability Program
Share