Redox Biochemistry

We study biomolecular reactions that convert electrochemical energy into chemical bonds of reduced products. This research advances the development of enzyme-based and microbial-based systems for the production of energy compounds and carriers.

Featured Publications

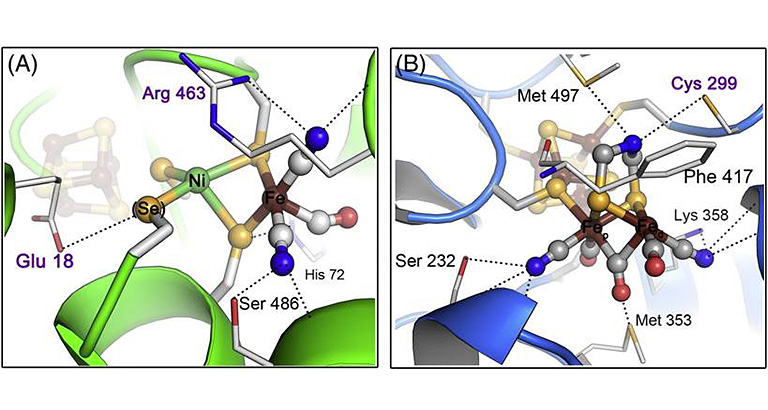
[FeFe]- and [NiFe]-Hydrogenase Diversity, Mechanism, and MaturationBiochimica et Biophysica Acta - Molecular Cell Research (2015)

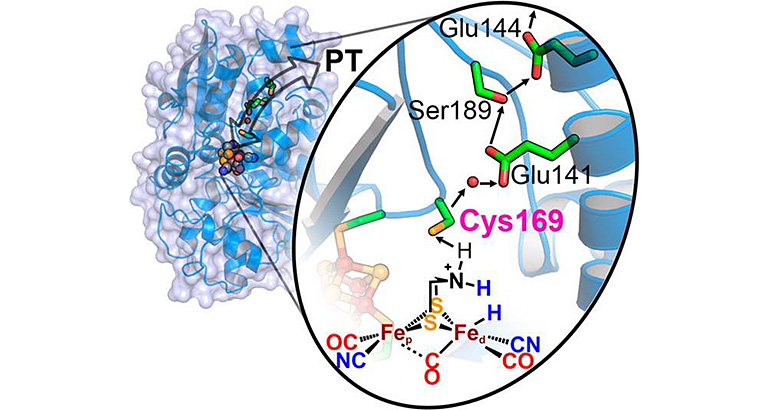
[FeFe]-Hydrogenase Oxygen Inactivation Is Initiated by the Modification and Degradation of the H Cluster 2Fe Subcluster, Journal of the American Chemical Society (2015)

View all NREL physical biochemistry publications.


Two side by side images. The left side is an illustration highlighting the paramagnetic properties of redox active cofactors in metallo and flavo- protein with several molecular clusters of yellow, red, blue, grey, and orange spheres attached to grey rods. Surrounding the cluster are five color-coded, glowing areas: purple is labeled Electron-transfer/EPR, red is labeled High-resolution structures/X-ray crystallography, green is labeled Intermediates/Pulse EPR, orange is labeled Catalysis/FTIF, and blue is labeled Mechanisms & Kinetics/Freeze-quench/Stop flow. The lower right shows a PCET reaction of 2 H+ + 2 e- = H2. The right image shows a photo of a Bruker electron paramagnetic resonance spectrometer in a laboratory setting.

Biophysics

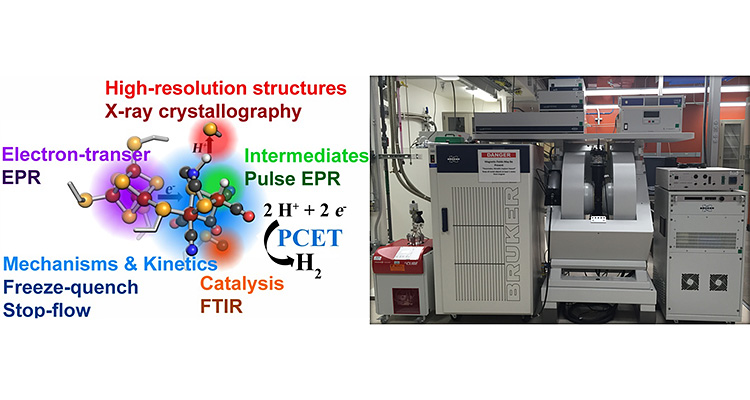
To evaluate the paramagnetic properties of redox active cofactors in metallo- and flavoproteins we have a spin resonance facility that houses a Bruker E-500 EPR and a E-580 pulse EPR with closed-cycle, He-cryostats (temperature range >4K), and a fiber optic laser and optical electron paramagnetic resonance (EPR) probes.

A set of three images. On the left is a transient absorption spectrum 3-D graph, showing the effects of Time (ns) and Wavelength (nm); the spectrum looks like a multi-colored rainbow of 3-D mountain peaks, going from highest to lowest: red, orange, yellow, green, blue, and finally purple. In the middles is an illustration of redox active enzymes and proteins showing three clusters of molecules in three color-coded sections: orange is labeled TAS with blue, red, and grey spheres connected to rods and a reaction of NAD(P)H to NAD(P)+; purple is labeled EPR with red and yellow spheres connected to rods and a reaction of 2 Fd(red) to 2 Fd(ox); blue is labeled FTIR with red, yellow, blue, and dark grey spheres connected by rods and a reaction of 4 H+ + 2 e- to 2 H2. On the right is a chart of the infrared spectrum of hydrogenase with Absorbance (x10 to the -2 A.U.) as the y-axis ranging from 0 to 6 and Wavenumber (cm to the -1) as the x-axis and ranging from 2100 to 1800. There are three vertical sections to the chart labeled, from left to right, vCN, vCO Terminal and vCO Bridging, and three horizontal sections labeled OX with blue solid peaks, the tallest in the vCO Terminal section, AP with blue dotted lines leading down from the OX section and grey outlined peaks, the tallest in the vCO Terminal section, and H2 with red dotted lines leading down from the AP section and solid red peaks, the tallest in the vCO Terminal section.

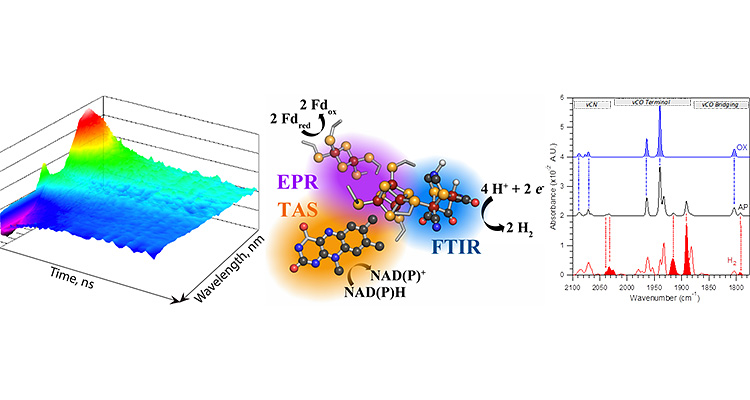
Optical Spectroscopy

Our capabilities include a range of infrared, mid-infrared, and ultrafast transient absorption (UV/visible) spectrometers that facilitate the study of very fast electron transfer events in a variety of redox active cofactors.
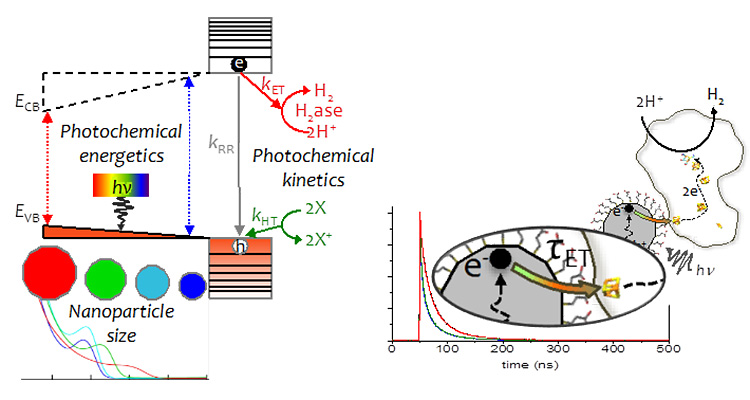
 The collage of illustrations and charts shows examples of how photobiohybrid complexes are being used to couple light-harvesting by nanomaterials to drive enzymatic redox reactions. The bottom left shows Nanoparticle size with varying sizes of spheres going from largest to smallest: red, green, turquoise, and blue, with correspondingly colored squiggly lines going from the large red sphere down to the bottom of an empty chart. Above this is a photochemical energetics diagram showing a narrower opening on the left side, with a red-dotted double arrow going from top to bottom labeled E(CB) at the top and E(VB) at the bottom, widening up on toward the right with a blue-dotted double arrow from top to bottom and further to the right a grey arrow pointing down, labeled k(RR) and Photochemical Kinetics, with e at the top and a reaction in red of k(ET) going to 2H+ to H2 H2ase, and h at the bottom with a reaction in green of 2X going to 2X+ and k(HT) leading to the h. To the right is a line chart with time(ns) as the x-axis, ranging from 0 to 500, and showing peaks of red, green, and blue that are tallest at 50, and leveling to 0 at around 200. Superimposed on top of the line chart is an illustration of a grey sun-like structure labeled e- and a dotted black arrow pointing to a black circle, then a prism arrow pointing right outside of the sun-like structure to a globular structure with yellow and orange clusters and dotted lines going between them labeled 2e and a reaction arrow of 2H+ to H2 leading out of the globular structure. A thick wavy line leads away from the sun-like structure to

Photobiohybrids

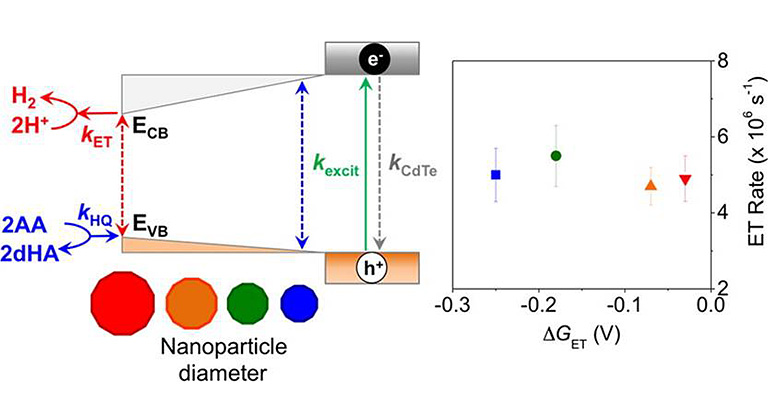
We have developed enzyme-nanoparticle complexes as photochemical systems to couple light harvesting to drive electron conversion reactions for deciphering fundamental mechanisms of electron transfer and catalysis in redox enzymes.

Photo of an anaerobic glove box with four black gloves attached to a box with a clear window and several shelves and apparatus inside.

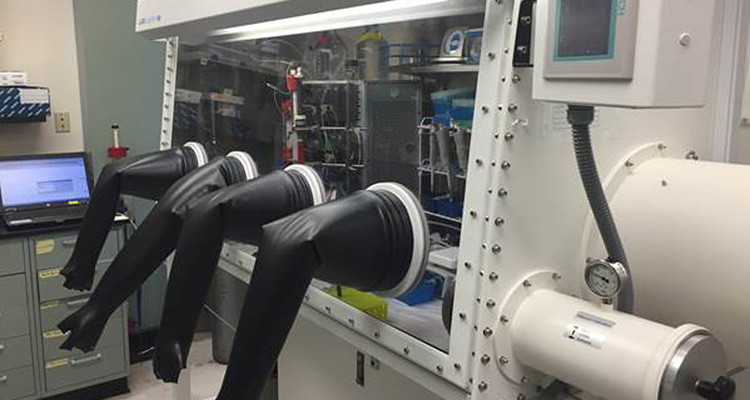
Anaerobic Biochemistry

We have developed recombinant expression systems for the production of a range of different metalloproteins including hydrogenases, hydrogenase maturases, ferredoxins, and flavin-containing enzymes.


Research Team

Principal Investigators

Paul King

Paul King

Scientist VI Supervisor, Photobiology Group

Paul.King@nrel.gov
303-384-6277
Pin-Ching Maness

Pin-Ching Maness

Principal Scientist, Photobiology Group Manager

PinChing.Maness@nrel.gov
303-384-6114
Jianping Yu

Jianping Yu

Section Supervisor, Photobiology Group, Biosciences

Jianping.Yu@nrel.gov
303-384-6277

Collaborators

Arizona State University, Jones Research Group

Carnegie Mellon University, Guo Research Group

Montana State University, Bothner Lab

Montana State University, Broderick Research Group

University of Colorado Boulder, Dukovic Research Group

University of Colorado Boulder, Smalyukh Research Group

University of Georgia Athens, Adams Research Group

University of Kentucky, Miller Research Group

Utah State University, Seefeldt Research Group

Funding for NREL's Redox Biochemistry R&D is provided by the U.S. Department of Energy, Office of Science, Basic Energy Sciences Program, and the Biological and Electron Transfer and Catalysis EFRC, an Energy Frontiers Research Center funded by the U.S. Department of Energy, Office of Science.


Share