
Biomass Compositional Analysis Laboratory Procedures
NLR develops laboratory analytical procedures (LAPs) for standard biomass analysis. These procedures help scientists and analysts understand more about the chemical composition of raw biomass feedstocks and process intermediates for conversion to biofuels.
Capabilities

Biomass Analysis
Our team can work with you to characterize the chemical composition of biomass feedstocks, intermediates, and products.

Near-Infrared Rapid Analysis
Our scientists use NIR spectroscopy correlated with compositional data from wet chemical techniques to develop rapid calibration models.
Overview

Summative Mass Closure for Feedstocks
Choosing the appropriate combinations of procedures allows for the summative mass closure of biomass feedstocks.

Summative Mass Closure for Pretreated Slurries
This summary procedure includes a discussion of each LAP necessary to obtain complete compositional analysis of dilute-acid-pretreated biomass slurries.
Procedures
NLR wrote these analytical procedures to help the research community characterize biomass. Before performing these procedures, review the documents in the overview section. The analytical procedures are in order of logical use.
This procedure allows for accurate and precise quantification of cellulose in samples with starch glucan present.
Download procedure: Determination of Cellulosic Glucan Content in Starch Containing Feedstocks.
This procedure describes methods for sample drying and size reduction, obtaining samples with a uniform particle size, and representative sampling of biomass samples.
Download procedure: Preparation of Samples for Compositional Analysis.
This procedure describes the methods used to determine the amount of solids or moisture present in a solid or slurry biomass sample as well as dissolved solids in a liquor sample. A traditional convection oven drying procedure is covered as is determining solids using an automatic infrared moisture analyzer.
Download procedure: Determination of Total Solids in Biomass and Total Dissolved Solids in Liquid Process Samples.
This test method covers determining ash expressed as the percentage of residue remaining after dry oxidation (oxidation at 550C to 600C). All results are reported relative to the 105C oven-dried weight of the sample.
Download procedure: Determination of Ash in Biomass.
This procedure covers determining nitrogen-to-protein conversion factors to estimate the amount of protein in a biomass sample.
Download procedure: Determination of Protein Content in Biomass.
This procedure covers determining soluble, non-structural materials in a biomass sample. The results are reported on a dry-weight basis as a weight percentage of the biomass. Extractives percentages are measured and used to convert compositions from an extractives-free basis to an as-received basis. Determining the amount of water-extractable sucrose is also covered.
This procedure should be performed before the Structural Carbohydrates and Lignin in Biomass procedure.
Download the procedure: Determination of Extractives in Biomass.
This procedure is for measuring carbohydrate and lignin content of samples without extractives. (For samples with extractives, see Extractives in Biomass above.) This procedure uses a two-step acid hydrolysis to fractionate the biomass into forms that are more easily quantified.
Download the procedure: Determination of Structural Carbohydrates and Lignin in Biomass.
View the three videos below for tips on the proper techniques.
Note: These videos were produced when the laboratory operated as the National Renewable Energy Laboratory (NREL). The laboratory is now the National Laboratory of the Rockies (NLR).
Stirring at 30°C
This video shows the techniques used at NLR to stir during the first stage of hydrolysis (72% H2SO4 / 30°C water bath). Notice that the tubes are not removed from the bath during stirring and that care is taken to ensure no particles are deposited higher up the sides of the tube.
Filtration After Hydrolysis
This video shows the filtration of the acid insoluble residue (AIR) after the second stage of hydrolysis (4% H2SO4 / autoclave). In the first clip, notice the hydrolysate is initially decanted to prevent deposition of solids onto the filter. Also note the filtration rate is typically slow and will become slower after the solids are on the filter. In the second clip, notice that once most of the liquid has been filtered, the solids are transferred into the crucible with a quick motion to ensure maximum suspension of the slurry. This helps prevent multiple rinses.
In the third clip, a sample of the filtrate is taken prior to adding rinse water. The fourth clip shows the rinsing of the solids from the tubes with deionized water. This rinsing of the tube is typically enough to rinse the filtered solids free of entrained carbohydrates and acid.
Acid Dilution
This video shows the dilution of the 72% H2SO4 to 4% with deionized water. A Dosimat is used in this video but is not required. In the first clip, notice the stir rod is used to physically remove particles from the glass at the beginning of the rinse step. In the second clip, all particles are rinsed from the stir stick. Do not forget to invert the tube or mix the solution prior to autoclave.
The concentrations of monomeric sugars (soluble monosaccharides), cellobiose, total sugars (monosaccharides and oligosaccharides), carbohydrate degradation products, and sugar alcohols can be determined using this procedure.
Download the procedure: Determination of Sugars, Byproducts, and Degradation Products in Liquid Fraction Process Samples.
This procedure covers determining the percentage of water-insoluble solids in a pretreated biomass sample after extracting all soluble components with aggressive water washing.
Download procedure: Determination of Insoluble Solids in Pretreated Biomass Material.
This procedure is used to separately quantify cis,cis-muconic acid and cis,trans-muconic acid as the total sum of biologically produced muconic acid present in the liquid fraction of pretreated lignin samples.
Download the procedure: Determination of cis,cis- and cis,transMuconic Acid from Biological Conversion.
This procedure describes the enzymatic saccharification of native or pretreated lignocellulosic biomass to glucose, cellobiose, and xylose in order to determine the comparative digestibility/conversion extent of the feedstock or the efficacy of various enzyme samples.
Download procedure: Low Solids Enzymatic Saccharification of Lignocellulosic Biomass.
This LAP consists of two sub-procedures. The first is hydrolysis of lignocellulosic biomass. The second is simultaneous saccharification and fermentation (SSF) of biomass. These procedures test a variety of lignocellulosic substrates and provide a consistent evaluation method. The procedures are for raw biomass substrates or washed, pretreated substrates only.
Download procedure: SSF Experimental Protocols — Lignocellulosic Biomass Hydrolysis and Fermentation.
Calculation Spreadsheets
These Excel spreadsheets calculate compositional analysis and mass closure based on the equations in the relevant LAPs:
Wood (hardwood or softwood)
Corn Stover (herbaceous feedstocks)
Biomass Hydrolyzate (liquid fraction produced from dilute-acid pretreatment)
Corn Stover Intermediates (solid fraction produced from dilute-acid pretreatment of corn stover—may also be used for wood intermediates and other herbaceous intermediates)
Nitrogen-to-Protein Factor Calculator
These spreadsheets work best in conjunction with the appropriate LAPs. Each workbook combines the calculations for one or more LAPs to facilitate summative mass closure or summative analysis. The "Read Me" page of each workbook contains important instructions and legal information.
Frequently Asked Questions
All current LAPs are in the procedures section. Some of the LAPs have new, descriptive titles instead of numbers. Several LAPs and versions of LAPs are no longer supported by NLR. NLR determined these LAPs were either outdated or incorrect, and we do not recommend using those procedures.
We offer one-week training tailored to your needs. The price is the direct cost of NLR's time to prepare for and teach the class, which includes a combination of lectures and hands-on learning for up to four students. For more information, contact Justin Sluiter, 303-384-6347.
We developed a number of rapid calibration models to predict the composition of a variety of biomass feedstocks and feedstock intermediates by correlating near-infrared (NIR) spectroscopy with compositional data produced using traditional wet chemical analysis techniques. NIR is a non-destructive spectroscopic method that requires as little as 500 mg of sample. For more information, contact Amie Sluiter or view a comprehensive list of our near-infrared rapid analysis services.
The complex structure of lignin makes it difficult and time consuming to determine coefficients for UV-Vis peak maxima and extinction. The values listed in the Determination of Structural Carbohydrates and Lignin in Biomass LAP were based on a LAP that is no longer available and not supported by NLR. We suggest using the value of a similar biomass type as an estimate. We are working to improve lignin measurements and will update the LAP when more information is available. Issues with this measurement can be found in Degradation of Carbohydrates During Dilute Sulfuric Acid Pretreatment Can Interfere with Lignin Measurements in Solid Residues.
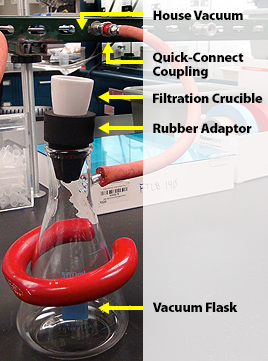
NLR uses the system pictured here. This consists of a vacuum flask with a rubber crucible holder and a filtration crucible attached to an in-house vacuum line. The vacuum attachment consists of vacuum-appropriate tubing and quick-connect coupling to an in-house vacuum line.
We have found that neutral detergent fiber (NDF) and acid detergent fiber (ADF) methods report different values. NDF/ADF methods are designed for measuring animal feed; they do not translate well for biofuels conversion. For more information, see Correlating Detergent Fiber Analysis and Dietary Fiber Analysis Data for Corn Stover.
In general, cellulose is the sum of glucose molecules, and hemicellulose is the sum of the remaining sugars, but this underestimates the complexity of the biomass because many other components are present.
Furfural, a degradation product of C5 sugars, is retained by the Pb column we use for carbohydrate analysis. This peak is regularly eluted in the area of oligomers in the following sample. UV detection can help identify a peak of furfural because it absorbs well and oligomeric sugars do not. If UV detection is not possible, increase the time between sample injections to shift the peak away from the carbohydrates.
The presence of salts in the sample will give a false signal in the refractive index used for carbohydrate measurements (see the figure below where this signal is highlighted in pink). This false salt peak can be eliminated by installing a de-ashing cartridge. These de-ashing cartridges must be changed periodically when the salt peaks begin to appear. Their lifetime depends heavily on the amount of ash in the samples and the care taken during neutralization.

This chromatogram shows a typical analytical hydrolysate of a corn stover feedstock using the Pb column. The cellobiose peak is an artifact of the chromatogram but is of particular scrutiny. Any actual cellobiose, as indicated by peak shape and retention time stability, suggests incomplete hydrolysis. The peak at about 6 minutes is furfural present from the previous injection.

This chromatogram shows a typical analytical hydrolysate of a feedstock sample using the Biorad Aminex HPX-87H column. The acetic acid peak at about 15 minutes is small compared to the carbohydrates between 6 and 12 minutes.

Analyzing samples for only glucan and xylan is possible, but determining the full composition takes little additional effort. The component mass closure information can help validate the results if the closure approaches 100%.
Process intermediate samples washed free of non-structural carbohydrates are the same as extracted feedstocks, and the analysis is the same after the process intermediate is washed.
We prepared calculation spreadsheets that we use at NLR. They are available in the calculations section.
Contacts
Biomass analysis training | Justin Sluiter
Contracted wet chemical analysis | Darren Peterson or Justin Sluiter
Near-infrared rapid analysis | Ed Wolfrum
Enzyme-related procedures | Michael Resch
Simultaneous saccharification and fermentation procedures | Robert Nelson
Share
Last Updated Jan. 26, 2026