Biochemical Conversion Techno-Economic Analysis
NREL's biochemical conversion analysis team focuses on techno-economic analysis (TEA) for the biochemical conversion of biomass to fuels and products via sugars and other components derived from lignocellulosic biomass.
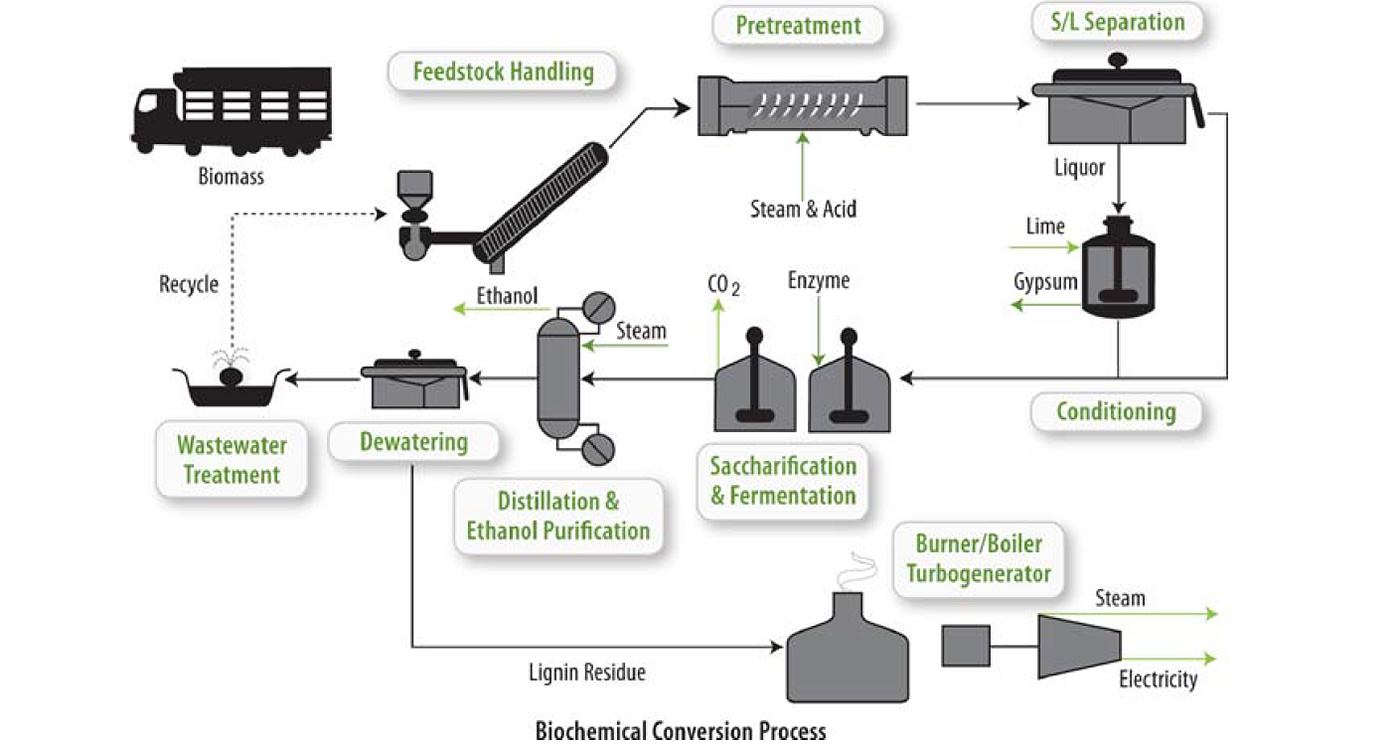
We help enable the production of cost-competitive hydrocarbon fuels and products from biomass in support of the U.S. Department of Energy's Bioenergy Technologies Office. The processes investigated through biochemical conversion analysis are broadly based on chemical, mechanical, and/or enzymatic deconstruction of lignocellulosic biomass to simple carbohydrates and other intermediates, followed by upgrading of these intermediate components to fuels or coproducts. TEA modeling helps to understand technical and economic implications for data gathered at bench- and pilot-scale operations, when extrapolated to a hypothetical commercial-scale integrated biorefinery.
Featured Publications
Process Design and Economics for the Conversion of Lignocellulosic Biomass to Hydrocarbons: Dilute-Acid and Enzymatic Deconstruction of Biomass to Sugars and Catalytic Conversion of Sugars to Hydrocarbons, NREL Technical Report (2015)
NREL 2012 Achievement of Ethanol Cost Targets: Biochemical Ethanol Fermentation via Dilute-Acid Pretreatment and Enzymatic Hydrolysis of Corn Stover, NREL Technical Report (2014)
Process Design and Economics for the Conversion of Lignocellulosic Biomass to Hydrocarbons: Dilute-Acid and Enzymatic Deconstruction of Biomass to Sugars and Biological Conversion of Sugars to Hydrocarbons, NREL Technical Report (2013)
Process Design and Economics for Biochemical Conversion of Lignocellulosic Biomass to Ethanol: Dilute-Acid Pretreatment and Enzymatic Hydrolysis of Corn Stover, NREL Technical Report (2011)
View all NREL biochemical conversion analysis publications.
Capabilities
Techno-economic analyses are performed to determine the potential economic viability of process technologies in the research and development stage. Evaluating the production costs of a given process technology, based on current performance and targets established for process improvements though research efforts, allows the analysis team to assess the potential economic feasibility of a process configuration. Results of these analyses are useful in determining which emerging technologies have the highest potential for near-, mid-, and long-term deployment success.
Conceptual process designs and detailed process models developed for TEA under this project allow the analysis team to evaluate aspects of process technology development like production costs, product qualities, heat integration, process optimization, and scale-up. The analysis team also assists the research efforts by helping establish technical targets for the research programs and quantifying the economic impact from research achievements. This helps direct research in the most impactful directions, with a goal of maturing toward commercial deployment. Sustainability metrics associated with the conversion processes are also tracked.
Within the Biochemical Conversion Analysis project, there are currently two primary integrated conversion pathways considered through TEA modeling, namely biological and catalytic conversion of sugars/hydrolysate.
Biological Pathway Analysis
We focus on biological (fermentative) upgrading of sugars and other components to fuel precursor intermediates and/or bioproducts, making use of organisms to perform the key conversion steps. TEA modeling work done under this pathway includes detailed design, processing, and cost considerations attributed to an organism's metabolic constraints, e.g., anaerobic versus aerobic fermentation, batch versus fed-batch or continuous bioreactor operations, and bioconversion heat and power optimization.
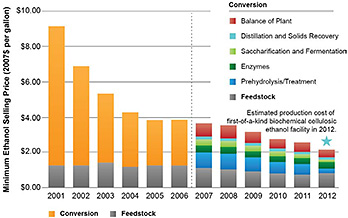
NREL's biochemical conversion analysis program has an established history of conducting detailed TEA modeling of biochemical pathways for more than a decade, both to track R&D progress attributed to BETO Platform research as well as for external partners and stakeholders, across a variety of target products including ethanol, other alcohols, hydrocarbon fuels, and chemical products. This figure provides one example of the Biochemical Analysis project's efforts to track R&D progress under BETO's ethanol program over the course of 10 years, culminating in the successful demonstration of nth-plant cost targets for biochemical ethanol production from corn stover at pilot scale (via biological conversion of sugars). Similar efforts are underway for R&D activities focused on drop-in hydrocarbon fuel production, as well as synthesis of bioproducts derived from cellulosic biomass.
Catalytic Pathway Analysis
Process modeling and analysis for the catalytic conversion approach may follow a similar processing conversion approach in terms of biomass deconstruction operations that typically may take place initially (although opportunities exist to tailor such operations to meet the needs of the downstream conversion steps), but instead focuses on catalytic upgrading of sugars, sugar derivatives, or other soluble carbon species to hydrocarbon fuels or chemical coproducts. Additionally, opportunities for hybrid pathways exist which may, for example, pursue biological synthesis of an intermediate product followed by catalytic upgrading of the intermediate to a finished fuel, blendstock, and/or coproduct. Research on a number of such pathways is ongoing at NREL and external commercial and research institutions.
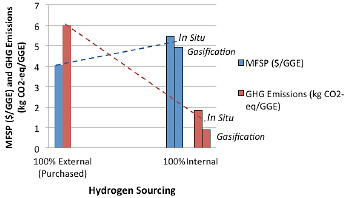
One example of TEA modeling work done under this pathway is that we've demonstrated the importance of quantifying tradeoffs between cost and sustainability that could be exhibited, e.g., between catalytic pathways that may enable high carbon yields but at the expense of high hydrogen consumption (in contrast to fermentative approaches, which typically lose more carbon as CO2 but do not require substantial external hydrogen inputs).
Research Team
Principal Investigators


Engineers
Related and Integrated Programs
Biochemical Process Development and Integration
Bioenergy Sustainability Analysis
Biogas Upgrading and Waste-to-Energy
Biological and Catalytic Conversion of Sugars and Lignin
Biomass Deconstruction and Pretreatment
Enzyme and Microbial Development
Collaborators
Argonne National Laboratory
Idaho National Laboratory
Pacific Northwest National Laboratory
Share