Innovative Analysis Tool Opens Path Toward Better Mobility for All
Mobility Energy Productivity Tool Is Helping Decision-Makers Visualize Equity Gaps in Transportation and Find Solutions

How long does it take you to get to work or school? The answer varies widely for many Americans, depending on factors like where they live and whether they own a car. Even in densely populated cities like New York, a day's routine can involve hours of commute time.
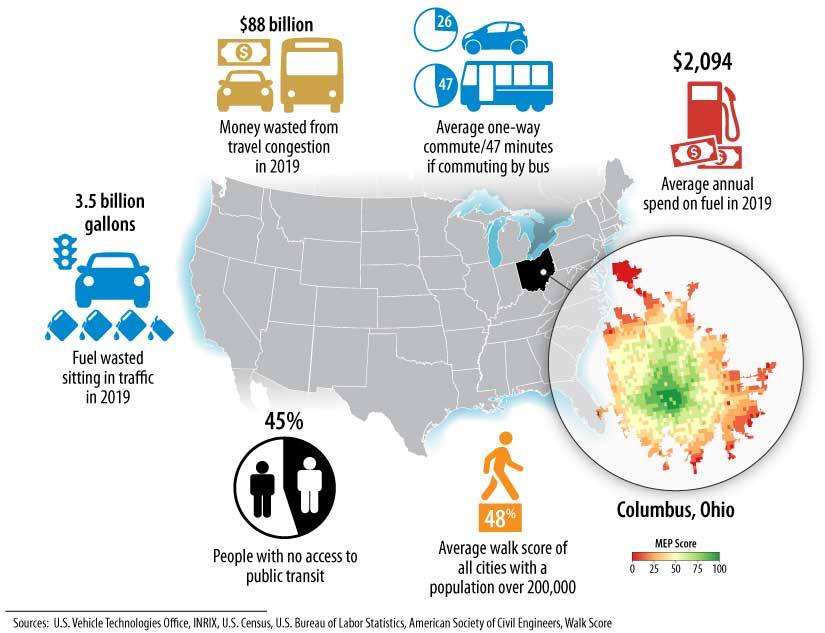
Many essential trips also gobble up fuel and an outsized share of household income. When it takes too long, costs too much, or consumes lots of energy to reach key places like jobs and healthcare, that is poor quality of mobility—and it affects everyone. Traffic congestion alone costs the U.S. billions of dollars in lost time and wasted fuel each year. Meanwhile, excess pollution from inefficient travel undermines climate goals and worsens air quality.
While insufficient mobility and accessibility have a broad impact, the burden falls most heavily on low-income areas, which typically have longer commutes, fewer transportation options, and higher transportation costs. Mobility equity issues affect the quality of life for millions, from rural areas to urban centers.
Researchers at the U.S. Department of Energy's National Renewable Energy Laboratory (NREL) have devised an innovative way to quantify and understand this problem: the Mobility Energy Productivity (MEP) tool. MEP distills three major components of mobility—time, cost, and energy—into a simple, easy-to-read score. That score can quantify the efficiency of connectivity provided by one or more travel modes (such as biking, driving, or public transit) for a given geographic area, from a small neighborhood to a large state. MEP can also analyze the quality of mobility for specific groups based on traits such as income, age, and vehicle ownership.
A New Window Into Mobility Equity
"With MEP, we can quantify disparities in mobility and access for underserved population segments," said Venu Garikapati, a senior transportation data researcher and one of MEP’s creators. "We have also shown possible improvements in mobility equity based on specific scenarios, such as high levels of ride-sharing."
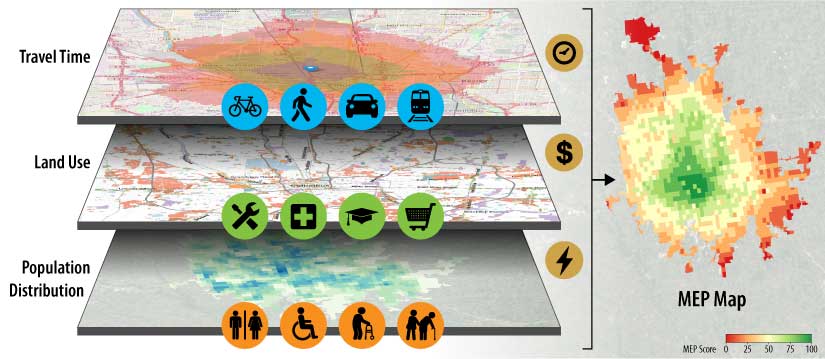
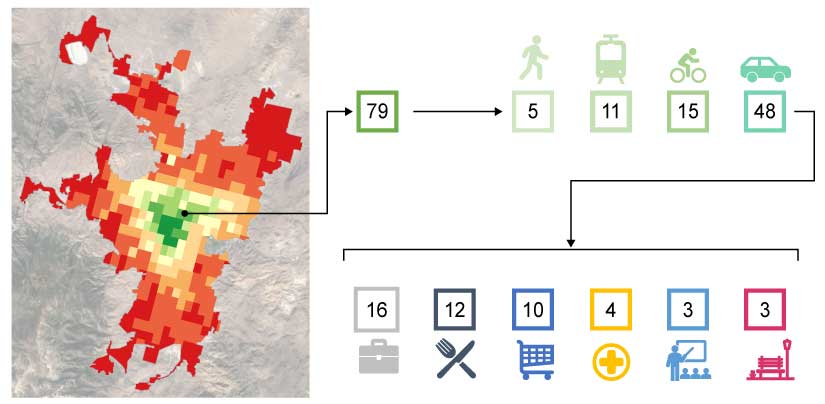
The MEP algorithm quantifies the total number of destinations in an area that people can reach within a certain amount of time. For any given square kilometer, the MEP tool calculates available opportunities across four modes (car, walk, bike, and transit), four travel time thresholds (10, 20, 30, and 40 minutes), and five distinct destination types (schools, hospitals, restaurants, recreational facilities, and shopping), in addition to quantifying access to jobs.
A city’s MEP score depends on the geography, building density, road network, mode availability, travel patterns, and efficiency of the entire transportation system to connect people to their destinations. Similar to a stock index, the score has no upper bound and can be benchmarked for a baseline year of choice, then tracked as a percentage increase or decrease from the baseline. Places that entail less travel time, money, and energy to reach are weighted more heavily than those typically farther away, which take more resources to reach.
MEP can also analyze the effectiveness of newer energy-efficient modes (such as electric vehicles) or cost-efficient modes (such as shared mobility services) within a given mobility system. Its flexibility, combined with the simplicity of having a single metric, makes MEP a powerful tool for government agencies, companies, and other organizations interested in improving transportation options. Multiple state transportation agencies—including those in Colorado, Delaware, and Florida—are evaluating the MEP tool to aid in decisions regarding infrastructure investments.
The Delaware Department of Transportation, for example, is conducting a trial of MEP for possible integration with its planning process, which includes criteria for mobility, access, and economic justice.
"Fundamental research like NREL's is absolutely critical—and having the opportunity to work with practitioners like us to try to implement the insights from that research is even more critical," said Anson Gock, a planner at the Delaware Department of Transportation.
StreetLight Data, which provides data and insights to hundreds of planning agencies and transportation firms across North America, is collaborating with NREL to explore the viability of integrating MEP with the company's existing suite of metrics and tools.
"Transportation professionals increasingly need comprehensive data, tools, and metrics to ensure they are progressively improving the quality of mobility in their communities," said Laura Schewel, StreetLight founder and CEO. "MEP represents an important tool to support these challenges."
Powerful Flexibility for Transportation Analysis
One or more parameters can be adjusted to refine a MEP analysis. A focus only on public transit, for example, will reveal neighborhoods where commuters save time, expense, and energy by taking the bus or train. It is possible to compare access to job opportunities between low- and high-income populations or to see how and where mobility varies with vehicle ownership.
Consider MEP maps of Chicago, Illinois, for two types of households: those with no vehicles and those with at least one vehicle for each driver. The difference is stark: the quality of mobility for the no-vehicle households is one-tenth of that enjoyed by residents with their own cars. The average trip made by zero-vehicle households is about twice as long—about 40 minutes—compared to households that have as many or more vehicles than drivers (or "vehicle-sufficient" households). Zero-vehicle households also have significantly fewer destinations reachable by walking, biking, or transit.
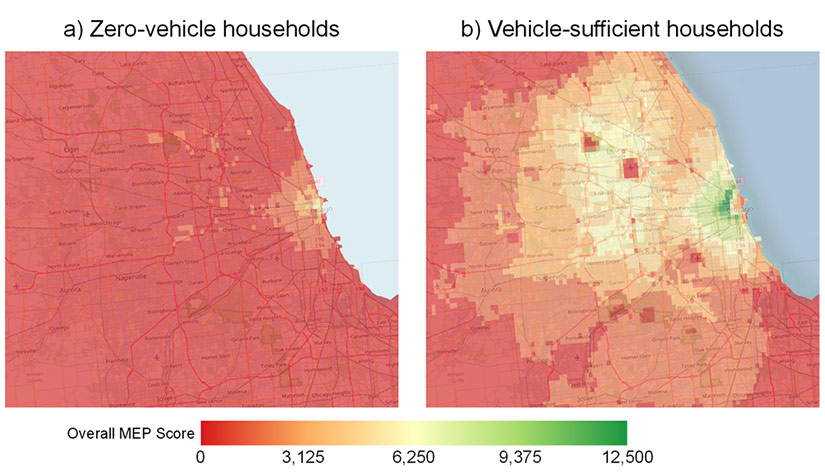
Decision-makers can use this information to determine where disparities are the greatest and direct investments toward those communities. Analyses like these can be conducted for any single demographic dimension (such as income level or vehicle ownership) or a combination of them.
“MEP opens up a different way to think about mobility,” said Christopher Hoehne, a mobility systems researcher on the MEP team. “Seeing a mapped analysis inspires thought about community planning—where important destinations are sited. It also reveals opportunities to link different modes of travel, such as biking to public transit.”
"Personal travel in America has historically been very car-centric, and our cities’ infrastructure reflects that—which is why we have tended to focus mainly on improving the efficiency and affordability of driving," Hoehne said. "But more and more, we're starting to see that increasing our focus on other modes of travel provides a way to incorporate equity and sustainability considerations into future transportation planning. Sometimes that involves combining different modes together."

Typical accessibility research in the transportation domain focuses heavily on time and cost, Hoehne said, adding that the team spent time developing the tool, and the metric behind it, to focus on the novel aspect of energy but is also looking at expanding MEP to capture even more aspects of mobility quality.
The MEP team is currently reviewing emissions data, for example, to better reflect greenhouse gases and directly account for criteria air pollutants in MEP’s calculations. In the future, the tool may also incorporate additional factors such as safety and infrastructure quality.
"We are only beginning to realize the full potential of what MEP can do,” Garikapati said, “and how it can be used to create healthier, more convenient mobility for everyone."
Learn more about NREL's transportation and mobility research. And sign up for NREL’s quarterly transportation and mobility research newsletter, Sustainable Mobility Matters, to get the latest news.