Dynamic Secondary Ion Mass Spectrometry
NREL uses dynamic secondary ion mass spectrometry (SIMS) for elemental analysis, depth profiling, interface analysis, and image analysis.
How It Works

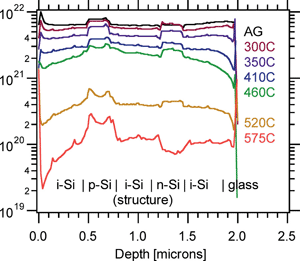
SIMS depth profiles of hydrogen for a series of a-Si films undergoing solid-phase recrystallization at different temperatures. Hydrogen loss is greater for higher temperatures; however, the rate of loss for a given temperature is also affected by the type of dopant and proximity to the surface.
Dynamic SIMS uses a continuous, focused beam of primary ions to remove material from the surface of a sample by sputtering. The fraction of sputtered material that is ionized is extracted into a double-focusing mass spectrometer, which uses electrostatic and magnetic fields to separate the ions according to their mass-to-charge ratio. Ions of different mass-to-charge ratios are selected by adjusting the strength of the magnetic field. Dynamic SIMS is extremely sensitive—able to detect fractions in the range of parts per million to parts per billion—and is used to determine the elemental composition and levels of trace impurities and dopants in solid materials.
Applications
Elemental Analysis
Identifies all elements or isotopes present in a material, from hydrogen to uranium. Different primary-ion sources (cesium and oxygen) allow the choice of conditions for the best analytical sensitivity across the periodic table, down to parts per billion for many elements. High mass resolution (M/ΔM of up to 6000) allows the separation of nominally identical masses (e.g., 31P from 30SiH). This is the only surface analysis technique for directly detecting hydrogen and deuterium in materials.
Depth Profiling
Sputtering into a material generates a profile of the concentration of impurities or dopants as a function of depth. Depth resolution of better than 10 nanometers (nm) is possible, and the technique can be quantitative with standards.
Interface Analysis
Sputter-removing material from the sample enables dynamic SIMS to determine the changes in composition or the diffusion of impurities from layer to layer. Variable primary-ion conditions allow depth resolutions of <10 nm.
Image Analysis
Raster scanning or the unique direct-imaging capability of the instruments can produce secondary-ion images for detecting the lateral distribution of trace impurities. Image analysis, combined with depth profiling, produces three-dimensional maps of elemental distributions.
Contact
Share

