Solar Energy Improving Resiliency: A Look at California During a Historical Drought
Aug. 19, 2015 by Alexandra Aznar
In February, the Solar STAT blog featured a post on 2012’s Hurricane Sandy and how solar PV can support disaster resiliency. Extreme weather events are not limited to hurricanes, of course. Others, like California’s ongoing drought, pose additional challenges for electricity generators but also demonstrate an emerging role for solar energy.
On January 17, 2014, California Governor Jerry Brown declared a state of emergency in response to the exacerbating state-wide drought (Figure 1) that officially began in 2011. The extreme heat and lack of precipitation that characterize this drought have had major impacts on how California generates electricity.
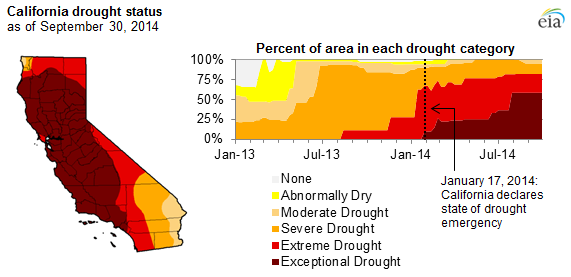
Figure 1. The extent of drought-impacted areas in California. Source: EIA, 2014
The drought has significantly impacted hydropower electricity generation. Between 2004 and 2013, hydropower typically provided 20% of total in-state energy generation in California, but dropped to 10% in early 2014 (Figure 2) (EIA, 2014). As a result, natural gas, wind, and solar have filled the electricity generation gap. Similar to historical low hydropower events, electricity generation from natural gas increased in 2014, but to 16% higher than the 10-year average (Figure3). A Pacific Institute study estimates that increased reliance on natural gas for electricity generation between 2012 and 2014 resulted in a $1.4-billion cost to California ratepayers and an 8% increase in carbon dioxide (CO2) emissions (Pacific Institute, 2015). Hydropower is a zero-emitting electricity generation resource whereas natural gas electricity generation produces CO2 emissions—although not at as high a rate as coal. Additionally, natural gas power plants, like other thermoelectric power plants, are large fresh water consumers so their increased use during drought can exacerbate water shortages.
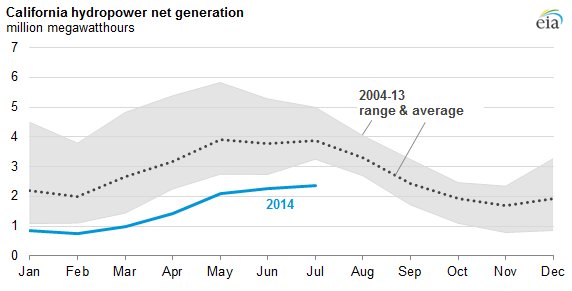
Figure 2. California hydropower net generation (2004-2013). Source: EIA, 2014
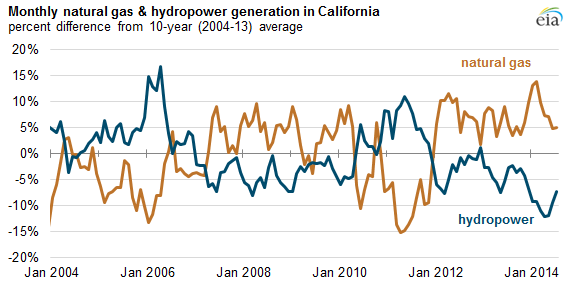
Figure 3. Relationship between hydropower and natural gas production (2004-2014). Source: EIA, 2014
At the same time, electricity generation from wind reached 8% of total generating capacity and utility-scale solar generated more than 5% of California’s total in-state annual utility-scale (1 MW or larger; includes solar photovoltaic and concentrating solar power) electricity generation (Figures 4 and 5).
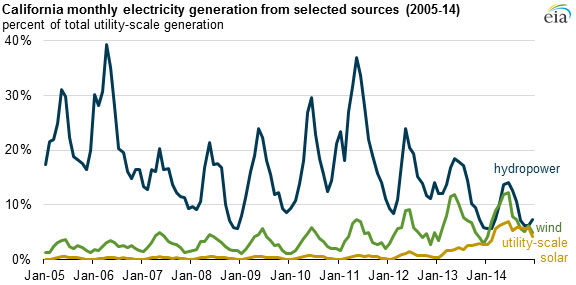
Figure 4. California monthly electricity generation from hydropower, wind, and utility-scale solar. Source: EIA, 2014
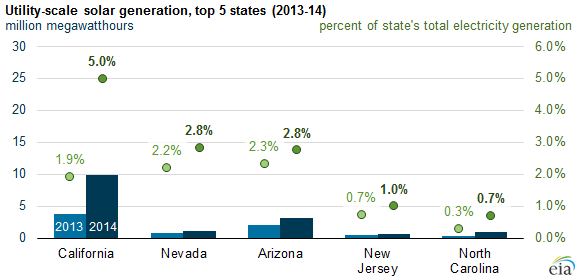
Figure 5. Utility-scale solar generation (2013-2014). Source: EIA, 2014
To an energy novice, 5% of a state’s energy portfolio from solar (Figure 5) may seem small but this figure is significant for two reasons:
- California is the first state to reach a 5% threshold from solar (Kaminsky and Baca, 2015)
- 2014 solar generation offset the majority (83%) of the hydropower generation decline, according to the Energy Information Administration (EIA), 2014 (quoted in Lacey, 2015).
Moreover, these figures do not include installed small-scale (typically residential and commercial-size) distributed solar capacity which the California Public Utility Commission (CPUC) estimates reached 2,300 MW in 2014 (California Solar Initiative and CPUC, 2015). Distributed solar PV typically decreases on-site electricity consumption; excess generation can be placed back onto the grid to be consumed by other electricity users. These numbers suggest that both utility-scale and distributed solar capacity have made important contributions to California’s electricity-generation response to drought.
California’s experience demonstrates how solar energy can support a state’s resiliency—to impacts of extreme weather events, on energy supply, and reliability. In particular, southwestern states may face more frequent and intense droughts as the climate changes; at the same time, these states have substantial solar energy resources that could be tapped. Solar-supportive state and local policies can influence levels of solar deployment, potentially leaving states better prepared to manage changes in energy supply due to drought.
For more information about the relationship between water and energy, read The Water-Energy Nexus: Challenges and Opportunities.
References:
U.S. Energy Information Administration (EIA). 2014. “California drought leads to less hydropower, increased natural gas generation.” Accessed June 30, 2015. http://www.eia.gov/todayinenergy/detail.cfm?id=18271#tabs_SpotPriceSlider-1
Gleick, P. 2015. Impacts of California’s Ongoing Drought: Hydroelectricity Generation. Pacific Institute. Accessed June 30, 2015. http://pacinst.org/wp-content/uploads/sites/21/2015/03/California-Drought-and-Energy-Final1.pdf
Kaminsky, J. and Baca, J. 2015. U.S. Solar Electricity Production 50% Higher than Previously Thought. Greentech Media. Accessed July 1, 2015. http://www.greentechmedia.com/articles/read/us-solar-electricity-production-50-higher-than-previously-thought
Lacey, S. 2015. As California Loses Hydro Resources to Drought, Large-scale Solar Fills in the Gap. Greentech Media. Accessed July 1, 2015. http://www.greentechmedia.com/articles/read/solar-becomes-the-second-biggest-renewable-energy-provider-in-california
U.S. Energy Information Administration (EIA). 2014. “Electric Power Monthly.” Accessed July 30, 2015. http://www.eia.gov/electricity/monthly/
California Solar Initiative and California Public Utilities Commission. 2015. “Go Solar California.” Accessed June 30, 2015.
Share
