New Capability for Nondestructive and Fast Module Spectral Response Measurements

Nov. 4, 2020

A solar module sits underneath a square shade that covers several cells around the measured cell. A bundle of black fibers runs from LEDs to the center of this shade to measure the desired cell.
The new quantum efficiency testbed uses optical fibers to direct the monochromatic LED bands into the optical head. The optical head is surrounded by a shade that isolates the cell under measurement. The rest of the module is illuminated with green LED floodlights (not shown here).
NREL’s cell and module performance team recently commissioned a new testbed for measuring the spectral response of silicon PV modules. Manufactured by Tau Science, the testbed uses 38 monochromatic LED bands in the 310-1195 nanometer (nm) wavelength range, directed to the measured cell via optical fibers. Green LED floodlights in the sample chamber create steady-state bias illumination for the module. The measured cell is made limiting by a shade mounted around the optical head as shown in the image to the right.

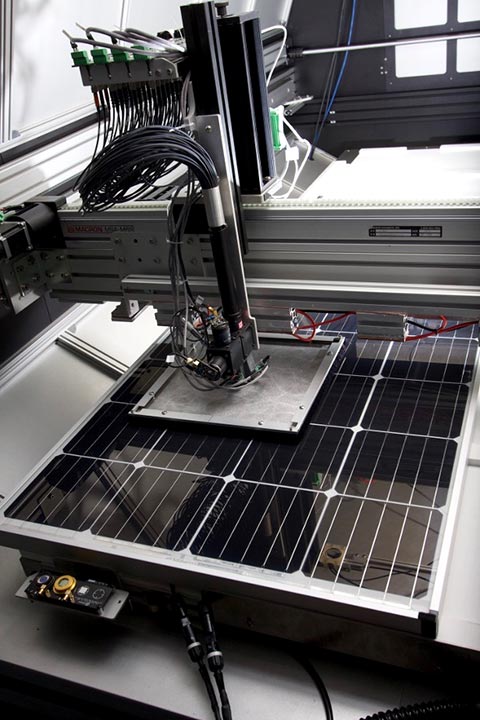
The module is connected in an AC short circuit configuration (open circuit at DC) and the LED bands are turned on and pulsed individually, allowing for fast collection of spectral response results (approximately 30 seconds per spot measured). In addition, the optical head can be programmed to move to various locations on the module, enabling the mapping of the spectral response at different locations on the module and even scanning multiple locations of the same cell. This new capability negates the need for the destructive and tedious procedure of tabbing individual cells through the backsheet to collect these measurements.

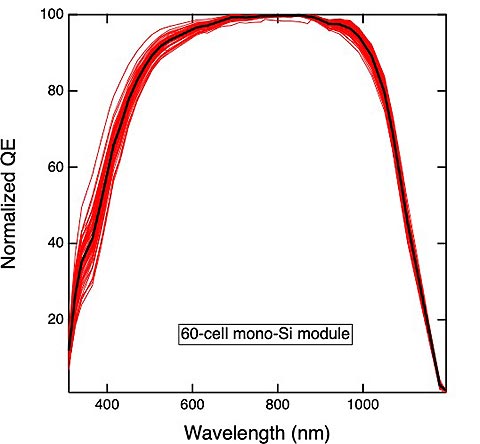
A representative example of results from the new testbed are shown in the graph below. The results from our module quantum efficiency (QE) testbed are used for the spectral correction of current-voltage (IV) measurements and to inform the uncertainty of the spectral correction factor. Additionally, they help us to quickly assess the quality of a module and check for damaged cells prior to flash or other testing.

A graph shows the results of test on a 60-cell silicon module. A bundle of red lines arching across the graph. The x-axis is labelled wavelength and the y-axis is labelled normalized QE.
Spectral response, represented as normalized (external) QE, of a 60-cell mono-silicon module. One spot is measured per cell (red curves) and the average normalized QE is shown in black.

Please contact us for more details on this new system and its capabilities.


Share