
Modeling and Analysis Inform COVID-19 Mobility Impacts and Vaccination Planning

A multipronged, data-informed mobility modeling and analysis effort led by a crosscutting team at the National Renewable Energy Laboratory (NREL) has identified pandemic-related travel changes—on the road and in the air—and informed regional vaccine administration site planning.
This work builds on research that began in 2020 when NREL's data analysis shed light on transportation patterns during the COVID-19 pandemic and helped inform epidemiological modelers about the spread of the virus. Later, the New York Times leveraged NREL's data science expertise to identify changes in rush hour patterns across the nation.
Travel Changes: On the Road and in the Air
Changes in When and Where People Are Spending Time
Researchers employed two newly developed metrics to analyze high-resolution trip data to quantify behavioral shifts in driving as a function of time, enabling comparisons before and after the pandemic began. As detailed in the related technical paper, they looked at three metropolitan areas with significantly different labor markets: Denver, Colorado; Louisville, Kentucky; and Des Moines, Iowa.
Although certain unique behavioral shifts emerged, common trends surfaced in the three seemingly distinct areas. For instance, drivers in all three areas spent more time at residential locations and less time in workplaces after the pandemic started. In addition, workplaces that may be incompatible with remote working, such as hospitals and certain retail locations, generally retained much of their pre-pandemic travel activity.
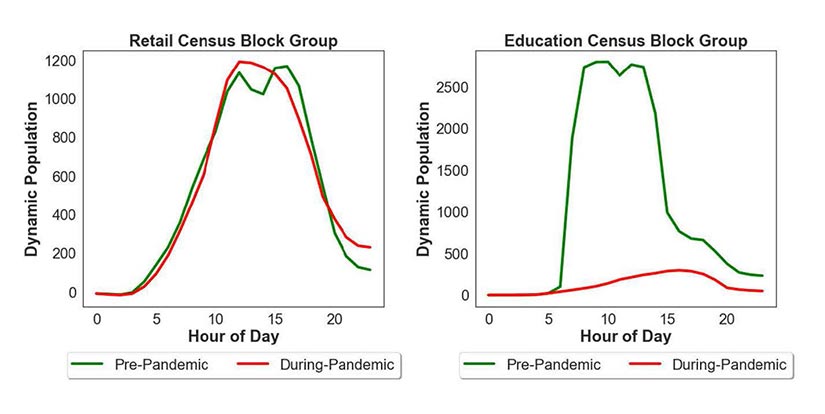
Researchers observed similarities in travel behavior for retail locations before and after the pandemic began (left), while, in stark contrast, they detected significant changes in travel behavior for educational locations (right).
Predicting Long-Distance Air Travel
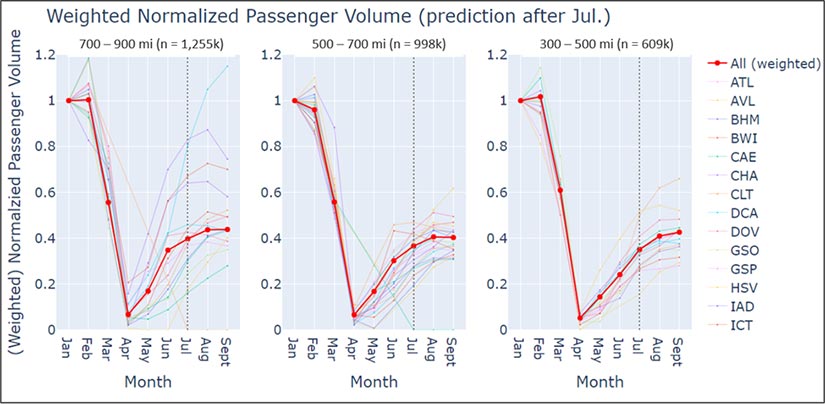
In a related effort, NREL also developed the Point-in-Time Air Travel Model, or PITA, to enable timely and accurate predictions of inbound traffic volumes from any domestic airport. PITA analysis results can inform national responses to critical events such as the COVID-19 pandemic.
Because of the lack of publicly accessible, real-time data on the number of passengers traveling from city to city, researchers tapped into two national data sets to estimate current airline passenger volumes between any two domestic airports. Using a combination of historical passenger count data from the Bureau of Transportation Statistics and near-real-time passenger departure data from the Transportation Security Administration, researchers can now estimate current air travel passenger counts for a given city or metro area.
Spotlight on Mobility in Denver
As a member of Denver's COVID-19 Mobility Task Force, NREL Transportation Behavioral Analyst Andrew Duvall provided national and regional insight into pandemic-related mobility changes along with information about emerging mobility technologies and practices that could benefit Denver. He also contributed to a report highlighting regional mobility changes that may become longer term or permanent, highlighting the need for resiliency and flexibility.
In a related effort, Duvall joined the advisory committee for the recently launched Denver Moves Everyone initiative, providing insight on mobility trends while also offering strategic guidance and analysis for regional mobility projects emanating from the initiative.
Vaccination Site Planning
Analyzing the Relative Ease of Accessing a Vaccination Site
NREL's Mobility Energy Productivity metric, or MEP, quantifies the ability of an area's transportation system to connect individuals to goods, services, employment opportunities, and other activities while accounting for time, cost, and energy. Using a modified version of MEP, researchers quantified the relative ease of accessing certain vaccine administration sites via a variety of travel modes—walking, biking, public transit, and driving—from any given location in the Denver metro area.
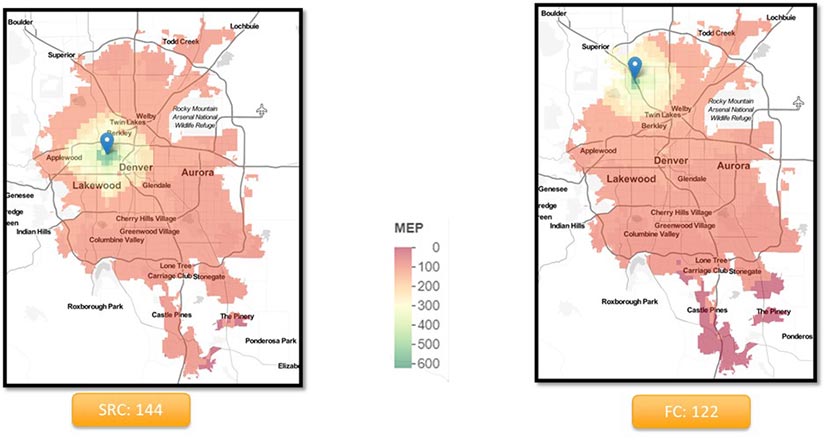
Mode-specific MEP scores can help identify sites with better access. For example, NREL's analysis showed that the Senior Resource Center near downtown Denver had a greater level of accessibility via walking, biking, taking public transit, or driving compared to the location at Fat Cats Fun Center in Westminster. In other words, the analysis suggests that the Denver site can be reached from a broader range of locations in the metropolitan region (and through a greater variety of modes) compared to the site at Fat Cats Fun Center in Westminster.
Optimizing the Vaccination Administration Process in NREL's Parking Garage
Using a microscopic urban mobility simulation package, researchers explored various scenarios focusing on optimizing vehicle movements and determining efficient locations for multiple administration and observation stations throughout NREL's parking garage.
"Our simulations revealed that scenarios with check-in times greater than 50 seconds could easily lead to large queue spill backs," said NREL's Qichao Wang, a computational scientist who led the study. "Although we never reached our full vaccine administration capacity, our analysis pinpointed the maximum number of vaccines—6,400—that NREL was capable of hosting per day."
Researchers also developed a queueing system designed to evaluate the performance of various volume scenarios and provide real-time estimates for wait times. The system comprises check-in, vaccination, and observation queues, with settings to minimize visit time. It can be used for both pre-day and same-day vaccine administration planning.
"The queueing system was modeled based on arrival patterns, which can be derived from vaccine appointments," said NREL's Bingrong Sun, a civil engineer who steered the development of the new system. "Even with our highest volume assumptions of 480–500 vehicles per hour, visit time was higher but still acceptable—with total time under 25 minutes in all proposed scenarios."
Expanded Research Could Inform Future Vaccination Pushes
Such analysis and simulation efforts could be expanded to help inform regional or national vaccination pushes in light of the Delta or other variants.
"A logical extension of this analysis would be to quantify how MEP scores vary across sociodemographic segments for each of the vaccine administration sites," said NREL's Venu Garikapati, a transportation data project leader who spearheaded the MEP modeling effort. "For example, further analyses could inform if there are disparities in access to vaccine administration sites for low-income or mobility-constrained populations."
Learn more about NREL's transportation and mobility research.
This article has been updated to reflect an editorial change made after its original publication.
Last Updated May 28, 2025