
NREL Examines U.S. Transportation Patterns During COVID-19 Pandemic

To predict the future, it helps to know a thing or two about the past. If you want to track down where the next viral hotspot might be, it is useful to know how those spreading the disease are moving.
National Renewable Energy Laboratory (NREL) researchers used travel data from across the United States to illuminate behavioral changes during the COVID-19 pandemic and help inform epidemiological modelers about the spread of the virus. Through a multitiered approach, researchers tapped into travel data to identify regions in the United States where high levels of intra-regional travel take place. They also analyzed changes in travel patterns and the impacts of work-from-home efforts throughout the pandemic.
Led by NREL Advanced Vehicle Simulation and Data Analysis Engineer Matthew Moniot, a research team employed long-distance travel data from the Federal Highway Administration to identify regions that could minimize inter-regional travel patterns and population mixing, which could help reduce the spread of the virus. Pre-pandemic data allowed the team to convey how people travel when no restrictions are in place.
Once travel returns to normal, decision-makers and epidemiologists in certain areas of the country can use this information to determine where they should expect visitors to come from.
The team's efforts were inspired by regional compacts formed in the early months of the pandemic. For example, a Midwestern compact formed when the governors from seven states, such as Illinois and Michigan, agreed to coordinate reopening efforts.
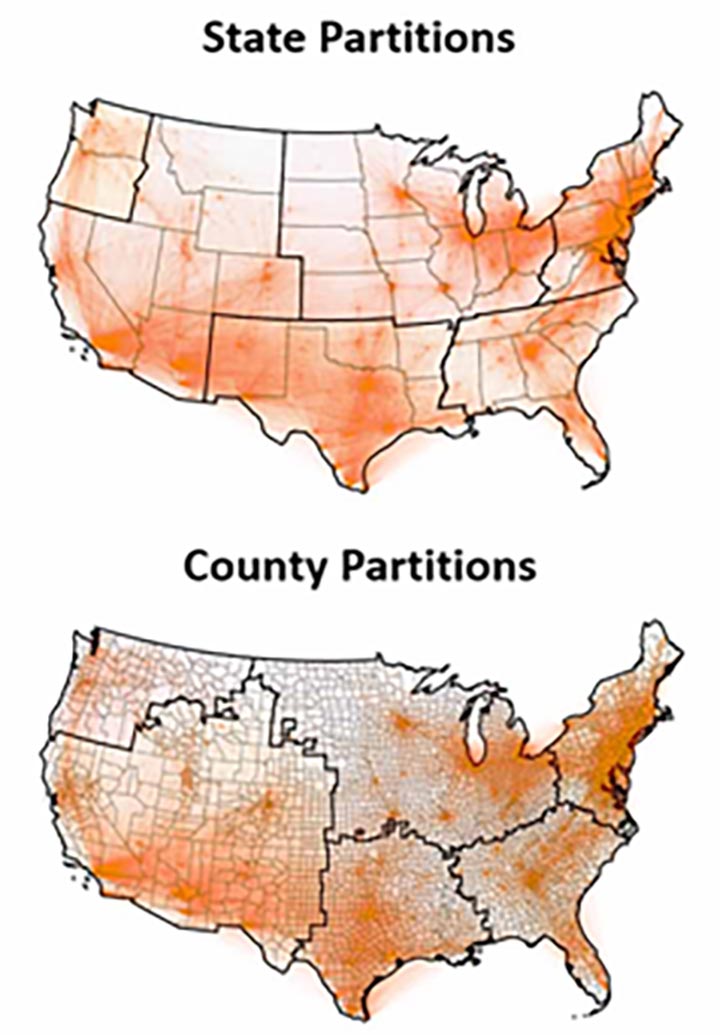
To outline the regions, the team created two maps—one with borders drawn on county lines and another with borders drawn on state lines. Although drawing boundaries on county lines provided the team with more flexibility, Moniot acknowledged that approach presented certain challenges.
"There is a political reality, if you will, where even though counties may out-perform states, these policies tend to be made at the state level. It may make logical sense for city mayors to coordinate policies, but it is more practical for governors to coordinate efforts on a state level," Moniot said.
Their findings also illustrate that although some states do not align politically, it could work in their best interest to create a compact to minimize the spread of disease. For instance, California and Washington may have similar political leanings, but California and Arizona have more in common regarding travel.
"The regions formed on the basis of travel data are different than what may come to mind, culturally," he added.
Examining Travel Behavior During the Pandemic
In contrast to NREL's pre-pandemic travel analysis, NREL Transportation Behavior Analyst Andrew Duvall and Mobility Systems Project Leader Stanley Young led a research team examining travel behaviors during the crisis.
In June, the U.S. departments of Transportation and Energy acquired a large data set from traffic data broker INRIX. Its 2020 National Trip Data includes approximately 10% of all vehicle trips in the United States, which equated to 14 billion records during the first six months of the year. The team also examined air travel trends and work-from-home data.
"We've made some discoveries through this process," Duvall said. "Specifically, that there isn't a great central repository for understanding long-distance travel behavior whether it's by air or ground. We've had to piece together data from multiple sources."
According to the INRIX data, the number of daily vehicle trips dropped drastically from January through April, then began to rebound in May. The data also illustrated, with so many people working from home, the weekday morning rush hour was significantly reduced.
The team examined NREL census block data as a case study. Before the pandemic, most employees arrived on campus around 7 a.m. and left around 5 p.m. Around 10 a.m., at the height of the workday, there were approximately four times as many people on the Golden, Colorado, campus pre-pandemic than during the pandemic.
Outside of Colorado, Young and Duvall's team is also collaborating with the New York Metropolitan Transportation Authority to create a model of the New York metro area. In the Midwest, the team is collaborating with Argonne National Laboratory in Chicago, which maintains a close relationship with the Chicago Transit Authority. Both transit authorities are using NREL's findings to examine the impacts of the pandemic and work-from-home behaviors.
Although their research will likely not be published in academic journals until next year, some mobility behavior findings from the INRIX data set are included in a data portal published by the Bureau of Transportation Statistics that illustrates vehicle travel trends and offers county comparisons.
"We're a small cog in this big machinery," Young said. "Everyone is moving rapidly and applying the best data and data science we have to inform the COVID crisis."
Learn more about NREL's transportation research as well as the U.S. Department of Energy's National Virtual Biotechnology Laboratory, a consortium of national laboratories with core capabilities relevant to the threats posed by COVID-19.
Last Updated May 28, 2025