Accurate Degradation Rate Calculation with RdTools
RdTools enables accurate time-series photovoltaic data and new insights into technology performance.

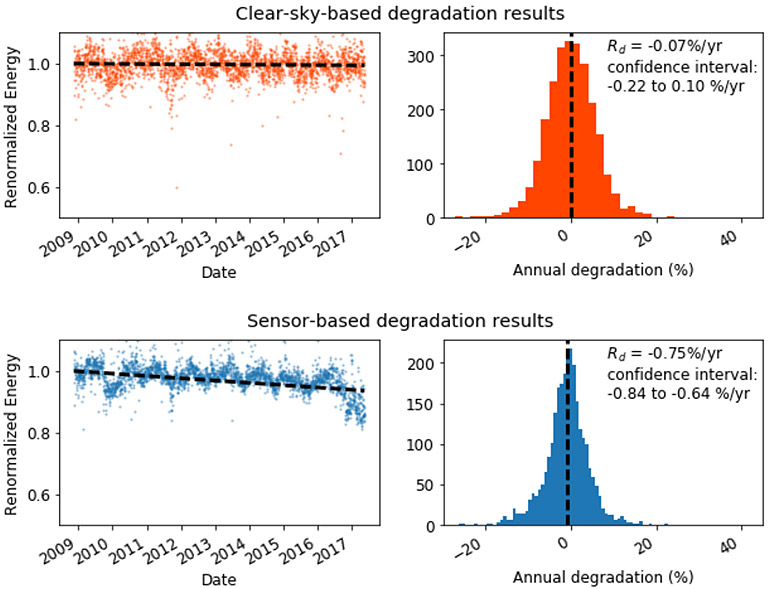
RdTools results show time-series data along with a year-on-year degradation distribution. The same system is analyzed with the clear-sky method (a) and sensor-based method with a poorly maintained sensor (b). In this case, high reported degradation is likely caused by sensor drift rather than a degrading PV module.
RdTools is a set of Python scripts and software for analysis of photovoltaic time-series data. The open-source tools were developed in collaboration with industry to bring together best practices and years of degradation research from NLR. Although the toolkit can be used for many useful PV analysis purposes, the primary use is to evaluate degradation rates over time.
The software can be accessed from the GitHub repo with installation instructions and usage examples provided.
The analysis software leverages several prior publications:
D. Jordan et al, "Robust PV Degradation Methodology and Application" (2017)
D. Jordan et al, "PV Degradation Methodology Comparison — A basis for Standard" (2016)
E. Hasselbrink et al, "Validation of the PVLife Model Using 3 Million Module-Years of Live Site Data" (2013).
Innovations include the option of a "clear-sky" normalization which calculates system performance ratio based on modeled, rather than site-measured, irradiance. This can be useful if ground-based irradiance sensors are misaligned, out of calibration, or unavailable. Also, seasonal effects such as soiling, shading, and temperature bias are minimized by use of year-on-year degradation calculation. Traditional linear regression is sensitive to outliers, missing data, and partial-year data sets. Year-on-year analysis aggregates multiple rates from datapoints separated by 365 days. Seasonal effects are minimized by only comparing points at similar times of year.

Year-on-year analysis aggregates multiple rates from datapoints separated by 365 days. The median of these rates is considered the "true" degradation rate, with the distribution width providing the uncertainty.
Contact
Share
Last Updated Dec. 6, 2025
