Photovoltaic Lifetime Project
High-accuracy public data on photovoltaic (PV) module degradation from the Department of Energy (DOE) Regional Test Centers will increase the accuracy and precision of degradation profiles calculated for representative PV hardware installed in the U.S.
PV modules typically degrade slowly—often losing less than 1% of their performance per year—making their degradation undetectable (within measurement uncertainty) for the first several years of operation. However, NLR researchers can distinguish a module’s degradation profile early in its life with careful indoor current-voltage (I-V) curve measurement methods and higher frequency of measurements. The PV Lifetime Project investigates equipment widely deployed across the United States and across multiple climates.
Tools and Capabilities
- Long-term deployment of PV systems with public data through the Regional Test Centers (RTCs)
- Validation and development of degradation rate standards
- Degradation assessment of existing PV system data
These activities are funded by the DOE Energy Office of Efficiency and Renewable Energy through the PV Lifetime Project and PV Proving Grounds Core Capability funding.
Field Data
Nine manufacturers and 12 PV module types are represented at the NLR PV Lifetime Project deployment in Golden, Colorado. See the Publications section below for performance reports for these systems.
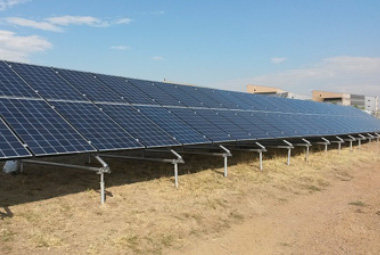
Jinko Solar
PV systems composed of 28 modules each of Jinko JKM260P-60 and Jinko JKM265P-60 were deployed at NLR (Golden, Colorado) and Sandia (Albuquerque, New Mexico). The systems are grid-tied through an ABB TRIO 20.0 inverter, in two strings of 14 modules apiece.
Initial baseline PV data were taken September 2016, with the modules installed at Voc October 2016. The PV system was grid-tied in April 2017.
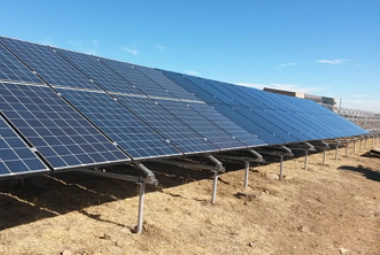
Trina Solar

Jinko Solar PV Lifetime installation at NLR.
PV systems composed of 28 modules each of Trina TSM-PD05.08 260W and Trina TSM-PD05.05 255W (black backsheet) modules were deployed at NLR (Golden, Colorado) and Sandia (Albuquerque, New Mexico). The systems are grid-tied through an ABB TRIO 20.0 inverter, in two strings of 14 modules apiece.
PV module baseline data were taken in October 2016, with modules installed Oct. 26, 2016. The PV system was grid-tied in April 2017.
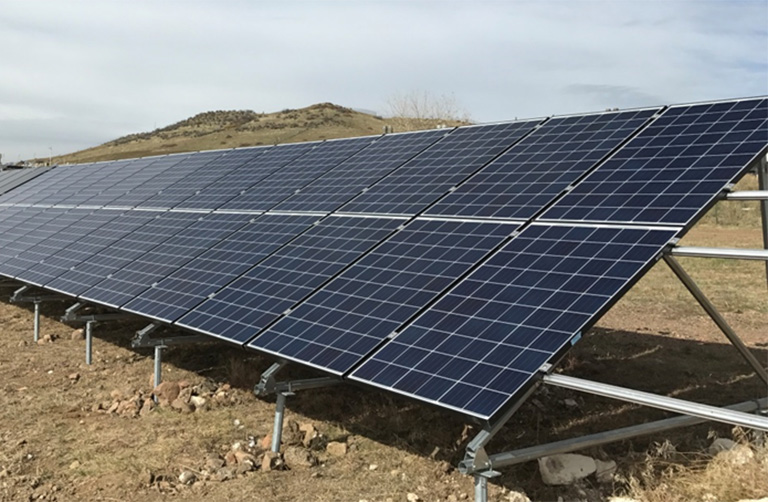
QCells

Trina Solar PV Lifetime installation at NLR.
PV systems composed of 28 modules each of QCells Q.Plus BFR-G4.1 280 (multi-PERC) and Q.Peak BLK-G4.1 290 (mono-PERC, black backsheet) modules were deployed at NLR (Golden, Colorado) and Sandia (Albuquerque, New Mexico). The systems are grid-tied through an ABB TRIO 20.0 inverter, in two strings of 14 modules apiece.
PV module baseline data were taken in July 2017, with modules installed Oct. 27, 2017.
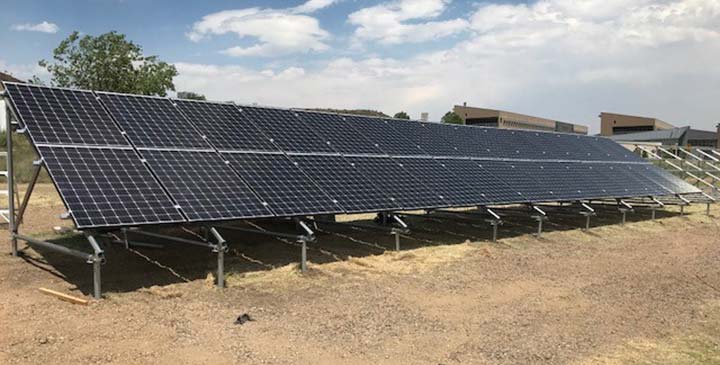
Panasonic, Canadian Solar, LG

QCells PV Lifetime installation at NLR.
Three separate PV systems were deployed in 2018, composed of 30 modules of Panasonic VBHN3305A16 (Heterojunction “HIT”), 28 modules of Canadian Solar CS6K-300MS (Mono-PERC), and 28 modules of LG LG320N1K-A5 (N-Type Mono-Si “NeON2”). The systems are grid-tied through HiQ ProHarvest inverters, in two or three strings apiece.
PV module baseline data were taken in June 2018, with modules installed June–October 2018.

Panasonic PV Lifetime installation at NLR.
Mission Solar, Prism Solar, Sunpreme Bifacial Tracker
A 10-row single-axis tracked system was installed at NLR in 2018–2019. The site supports three PV Lifetime systems: 20 modules each of Mission Solar MSE360SQ6S (Mono-PERC), Sunpreme Maxima HxB 400 (bifacial HJT), and Prism Solar Bi72 (bifacial PERC). The systems are grid-tied through SolarEdge SE20k inverters and utilize module-level power optimization to identify rear irradiance mismatch throughout the system.
PV module baseline data were taken in early 2019, with modules installed March 2019. Data is available publicly through the DuraMAT Data Hub.
Bifacial Tracker installation at NLR.
Publications
Journal articles, technical reports, conference papers, and outreach documents related of PV degradation rate are published through DOE SuNLaMP-sponsored work. Check out a summary of DOE-sponsored research on degradation rates.
PV Lifetime Project – 2024 NREL Annual Report, NLR Technical Report (2024)
Onymous Early-Life Performance Degradation Analysis of Recent PV Module Technologies, Progress in Photovoltaics (2023)
PV Lifetime Project – NREL Annual Report, NLR Technical Report (2022)
PV Lifetime Project: Measuring PV Module Performance Degradation: 2018 Indoor Flash Testing Results, World Conference on Photovoltaic Energy Conversion (2018)
NREL Adds Solar Array Field To Help Inform Consumers, Phys.org News Story (2016)
Contacts
Share
Last Updated Dec. 6, 2025
