
Statewide Residential Building Upgrade Planning Just Got Easier Thanks to New Dashboard
NREL's Interactive Dashboard Is Changing the Game When It Comes to Disseminating Efficiency and Electrification Modeling Package Results
Communities and states looking to develop decarbonization plans for residential buildings now have a new tool at their disposal thanks to National Renewable Energy Laboratory (NREL) researchers.
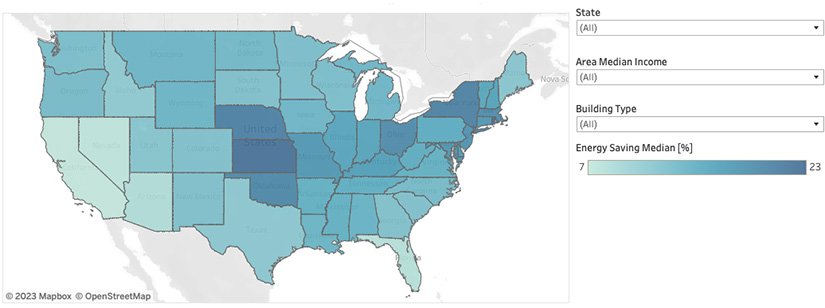
A recently launched Tableau dashboard utilizing ResStock™ data disseminates energy efficiency and electrification package modeling results to residential housing consumers across the contiguous United States and the District of Columbia. Users can view the impact of 16 energy efficiency and electrification package models for various residential units by state, filtering through housing stock, heating and air conditioning type, and other energy considerations. The data cover everything from heat pump water heaters in apartment complexes in Arkansas to basic enclosure improvements (e.g., air sealing, attic insulation) in single-family homes in Wyoming.
"When we talk about climate action, cities and communities are an essential part of any successful strategy," said Lixi Liu, a researcher in NREL's Building Technologies and Science Center. "NREL is positioned to do this kind of research and development to help cities and communities turn their building stock into one that is low-carbon, high-efficiency, and climate-resilient."
This is the first time that ResStock data has been utilized this way to illustrate the technical potential of energy retrofits. ResStock is a versatile tool developed by NREL that takes new approaches to large-scale residential energy analysis. While ResStock provides a wealth of information, incorporating over 100 housing characteristics, it can be overwhelming to navigate for audiences without a technical background.
In order to improve the accessibility of the data, Liu and fellow NREL researcher Jes Brossman leveraged ResStock's End-Use Savings Shapes data set and augmented it with additional metrics, such as area median income and energy burden, or the amount of gross income spent on energy expenses. This data set built upon calibration and validation against real data from a previous End-Use Load Profiles project to show the "what-if" potential of scaling efficiency and electrification measures across the country. The final product was then inputted into the analytics program, Tableau, to create a user-friendly dashboard for anyone interested in efficiency and electrification information.
"People deserve answers when it comes to their housing," said Jes Brossman, a researcher in NREL's Building Technologies and Science Center. "This dashboard can be used by anybody from what I call 'concerned citizens' to someone who's just really interested in what some of these technologies could look like in their own home, all the way up to State Energy Offices."
Though the dashboard is available to a broad audience, it was initially developed to support research for the U.S. Department of Energy's Communities LEAP (Local Energy Action Plan) program, which aims to facilitate sustained community-wide economic and environmental benefits through the Department of Energy's clean energy deployment work.
The creation of the state-level dashboard will eventually lead to another dashboard that performs similarly at the community level. However, Liu and Brossman see the appeal of the current dashboard for homeowners and residents, though they caution that individuals looking to incorporate these measures should do so after the completion of an energy audit or with the support of a qualified professional.
"I'm in the middle of trying to electrify my own house, so this project hits close to home," Liu said.
"I loved being able to compare scenarios from different states," Brossman said. "What are some of the savings people have in Maryland vs. Michigan? How are they different compared to income and other factors?"
The team is now turning their attention to internal trainings on dashboard usage, as well as working on disseminating ResStock data to cover more individual technologies. Ultimately, the team hopes that these data help ease the transition away from fossil fuels and into a more sustainable future.
Last Updated May 28, 2025