
Updated Tool Makes Calculating EV Emissions Easier, More Precise
Updates to the Electricity Sources and Emissions Tool Feature Improved Graphics, Refined Calculations, and an Embeddable Widget for Easy Sharing
Electric vehicles (EVs) typically produce fewer emissions than conventional vehicles, but when measuring emissions, the source of electricity matters. The emissions benefit varies from one state to the next depending on how the electricity to charge the battery was generated.
Charging up in a state with a strong mix of renewables, for example, may see comparatively lower well-to-wheels emissions than in a state with a predominately fossil-fuel-powered grid.
To make it easier to accurately measure the emissions of EVs and plug-in hybrid electric vehicles (PHEVs) at the state and national level, National Renewable Energy Laboratory (NREL) researchers refined the Electricity Sources and Emissions tool, a popular feature of the U.S. Department of Energy’s Alternative Fuels Data Center, with more precise assumptions and improved features.
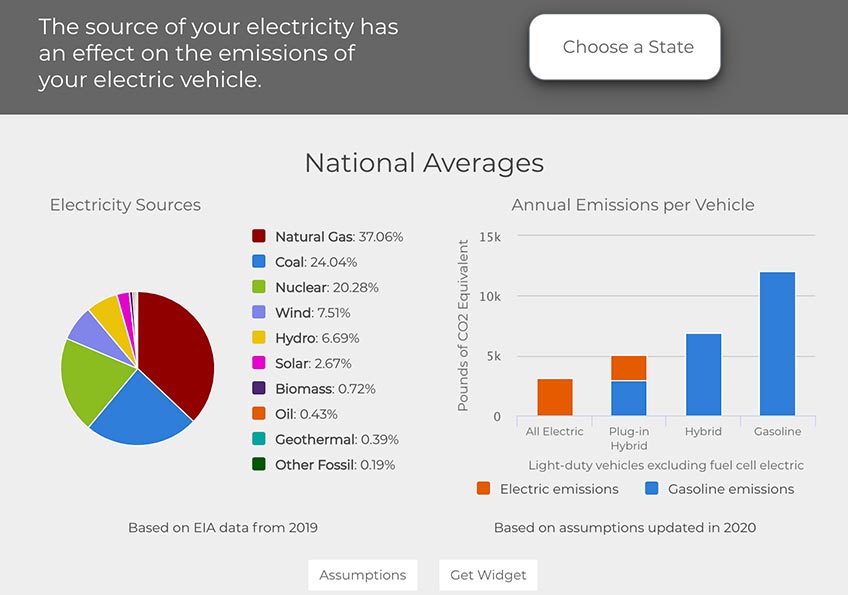
A refined tool for greater precision—the Electricity Sources and Emissions tool leverages an easy-to-use platform to communicate the latest electricity sources data and how it affects well-to-wheels emissions of electric vehicles.
"We've kept the same approach as before but have sharpened the assumptions and energy data behind the tool," said Jesse Bennett, an EV expert at the laboratory who oversaw the updates. "The sidebars in the tool really frame the average emissions of EVs and PHEVs in a simple and easy-to-digest manner."
Since first created in 2010, the tool has been a staple of the Alternative Fuels Data Center, using simple graphics to communicate the results of sophisticated estimates of EV emissions.
One of the main improvements in the newest version, according to Bennett, is a refined method for gauging statewide grid emissions.
"We wanted to give users even greater data resolution, especially as the energy landscape continues to evolve in the United States," he said. "By using net generation data at the state level, we account for possible differences in generation technology across the country."
Rather than making a national assumption on emissions for each energy source—be it natural gas, coal, nuclear, or renewables—the tool now uses U.S. Energy Information Administration data to calculate the weighted average emissions for all energy consumed in each state.
The result is a surprisingly simple interface that allows users to estimate the well-to-wheels emissions of an EV with only a few clicks. According to the tool, the typical EV in the United States emits 64% fewer air pollutant and greenhouse gas emissions on a well-to-wheels basis than a typical internal combustion engine vehicle.
Here is an overview of the other primary updates to the tool:
- Refined bar charts to distinguish tailpipe emissions from grid-related emissions. When running on electricity alone, EVs and PHEVs produce zero direct, or "tailpipe," emissions. However, PHEVs also produce tailpipe emissions when using their gasoline or diesel engines. The updates include a new color scheme to clearly differentiate upstream, electric emissions from those coming directly from the tailpipe.
- Updated assumptions to account for evolving travel patterns and vehicle market. To account for ever shifting driving habits and patterns enabled by emerging technologies—such as the expanding range PHEVs can travel on electricity alone—researchers revised travel and efficiency assumptions used to calculate emissions. The assumptions with sources can be easily accessed while using the tool.
- New embeddable, freely available widget to support easy sharing. To allow individuals and organizations to share the tool on their own websites, blogs, or social networking sites, NREL researchers created a freely available widget with HTML code that can be easily embedded on most online platforms.
Learn more about NREL's transportation research and how its technical expertise helps integrate emerging vehicle technologies.
Last Updated May 28, 2025