
Inaugural Edition of Industrial Data Book Identifies Trends in How Industry Uses Energy
U.S. industry used nearly 33 quadrillion British thermal units in 2018, or one-third of total energy consumption, according to the newly released 2018 Industrial Energy Data Book. Energy use for the sector has gradually increased since the 2007–2009 recession (2% from 2017 to 2018), and industry continues to be the largest energy end-use sector in the United States.
A new resource published by the U.S. Department of Energy's (DOE's) National Renewable Energy Laboratory (NREL) on behalf of DOE's Office of Energy Efficiency and Renewable Energy, the Industrial Energy Data Book summarizes the status of and presents key trends in energy use and its underlying economic drivers across the four industrial subsectors: agriculture, construction, manufacturing, and mining. Given the relationships between energy and water use, industry water withdrawals are also discussed in the data book.
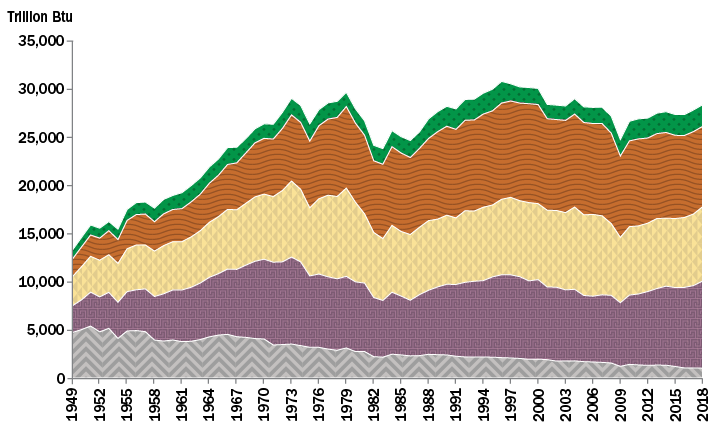
U.S. Industrial Energy Use by Fuel (1949–2018)
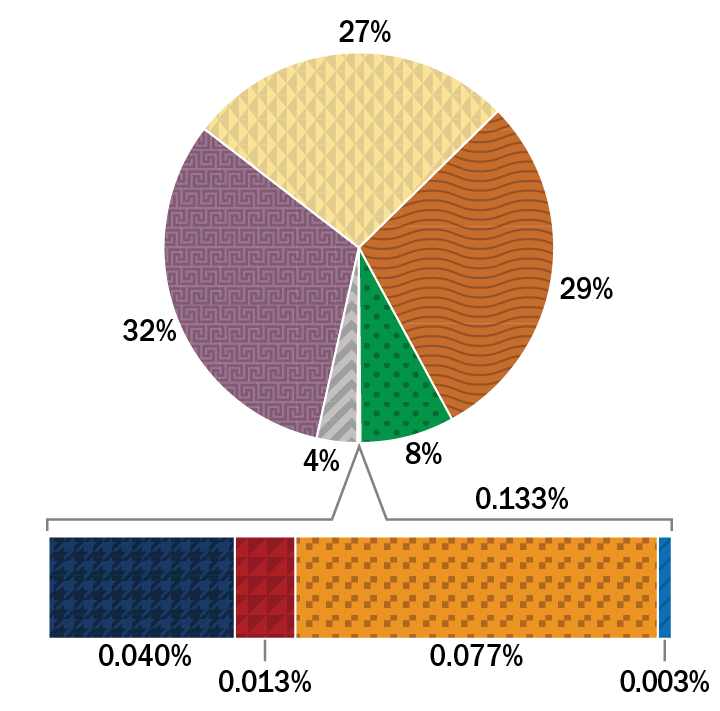
U.S. Industrial Energy Use by Fuel (2018)
The Industrial Energy Data Book shows the increasing role of natural gas as an industrial fuel. In 2018, industry was the second-largest consumer of natural gas, behind electric power generation.
Please contact the webmaster if you need help interpreting these charts.
The Industrial Energy Data Book shows the increasing role of natural gas as an industrial fuel. In 2018, industry was the second-largest consumer of natural gas, behind electric power generation.
Produced by NREL's Strategic Energy Analysis Center, this inaugural edition of the Industrial Energy Data Book provides an overview of the largest, yet least extensively quantified energy end-use sector for audiences unfamiliar with the sector, as well as for industrial energy experts. Due to the reporting schedules of underlying data sources, data are reported for years 2016–2018.
"We're excited to debut this new data collection, which shows that in 2018 three energy carriers—natural gas, electricity, and petroleum products—made up nearly 90% of industry's total energy use and almost 96% of its $78 billion total energy expenditures," said NREL Senior Analyst Colin McMillan, co-author of the report. "We also estimate that the largest energy-using facilities comprise about 0.3% of all industrial facilities but burn the equivalent of 28% of the sector's energy."
Other key insights from the data include:
- In 2018, the industrial sector consumed less electricity than both the residential and commercial sectors. Industrial electricity consumption has gradually decreased since its peak in 2000.
- Renewable energy sources—which are nearly all biomass—made up about 8% of total industrial energy use in 2018, roughly the same portion as in 2017.
- Texas, Louisiana, and California are home to the greatest share of large energy-using facilities due in part to the prevalence of petroleum refining and petrochemicals industries. Together these states account for about 37% of total industry energy use.
The report is accompanied by downloadable data of energy estimates for large facilities and for counties. The source code used to produce these estimates is also publicly available for download and use.
Learn more about NREL's energy analysis research.
Last Updated May 28, 2025