
NREL Delivers Industry-Shifting Software for Visualizing Wind Power Forecasts
Electric grid operators need the ability to plan generation to meet load, whichever way the wind blows. This means that they need access to real-time information—easily navigable and visually coherent—to truly build an intuition around wind power. They now have access to such information with WindView, a tool for visualizing wind power forecasts, created by NREL, Argonne National Laboratory, and the University of Texas at Dallas.
“The important thing for system operators is to develop an intuitive feel for what the wind on their system typically does,” said Bri-Mathias Hodge, chief scientist at NREL. “WindView gives them as much information as possible to make decisions.”
WindView unites a free forecaster, M3, that uses the best available machine learning forecasting techniques, both deterministic and probabilistic, with a clear presentation of wind data. Users can customize and visualize WindView forecasts, creating a sort of playground for wind power. Most importantly, WindView’s forecasts complement an operator’s fast-paced control decisions.
“Operators don’t want to be wasting time or writing a query to find wind power data. WindView is real time; you can see the wind events happening quickly,” said Erol Chartan, NREL researcher and principal investigator for WindView.
WindView is a response to system operators’ call for new situational awareness tools. DOE’s Grid Modernization Laboratory Consortium granted three years of funding to NREL and partners to develop such a tool, which fell under the leadership of Chartan. Prior to joining NREL, Chartan worked on wind power visualization software for Great Britain’s National Grid—in exactly the same control room where WindView could find its first real-world use.
As for the next steps, DOE's Solar Energy Technologies Office is funding a rework of WindView for wind’s variable resource cousin, solar energy. The design of WindView benefits forecasting in both energy resources.
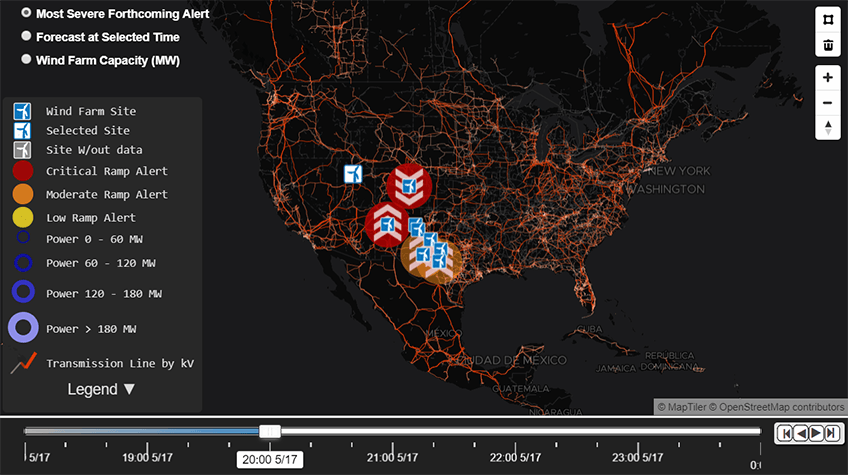
“WindView’s map really sets it apart as a forecasting tool,” said Chartan. “It helps to understand the spatial element, especially alongside up-to-date graphs that are displaying the data you want.”
WindView is ready for use by utilities, system operators, researchers, or forecast providers. View the tutorial to learn more, and contact Erol Chartan for partnership inquiries related to WindView.
Last Updated May 28, 2025