NREL designed this interactive material screening data tool to help fuel cell developers and material suppliers explore the results of fuel cell system contaminants studies.
Learn more about NREL's fuel cell system contaminants project performed in collaboration with General Motors, the University of South Carolina, and the Colorado School of Mines.
Select from the drop-down lists of materials to see the screening data collected from multiple methods. You can also view the data tables. The screening techniques include leaching tests (90°C, 1 or 6 weeks, 150 mm2/mL) to extract water-based contaminants; solution conductivity; pH; total organic carbon (TOC); cyclic voltammetry (CV); membrane conductivity; in-situ 50 cm2 fuel cell test; and advanced analytical characterization [gas and liquid chromatography mass spectrometry (GCMS, LCMS), inductively coupled plasma–optical emission spectroscopy (ICP-OES), and ion chromatography (IC)]. This tool is in development and NREL will add materials and results over time.
This tool is in development and NREL will add materials and results over time.
|
|
|
|
|
|
Total Anions [IC] and Total Concentration of Elements [ICP] in Leachate SolutionsGraph of the total anion concentration (measured by ion chromatography) and the total concentration of elements (measured by inductively coupled plasma) in leachate solutions. Each plot shows a large point for the selected material and small points for the other materials of the same type, color-coded by material class. | Quantity of Ions and Organics in Leachate SolutionsGraph of the quantity of ions (measured as solution conductivity) and organics (measured as total organic carbon) in leachate solutions. Each plot shows the selected material compared with other materials in the same class. | ||||||
Identity and Quantity of Anions in Leachate Solutions [IC]Graph of the identity and quantity of anions in leachate solutions (measured by ion chromatography). Ions measured include F, Cl, Br, NO3, PO4, and SO4. | Identity and Quantity of Top 6 Elements by Concentration [ICP]29 elements were analyzed using ICP-OES Graph of the identity and quantity of the top six elements by concentration (measured by inductively coupled plasma-optical emission spectroscopy). | ||||||
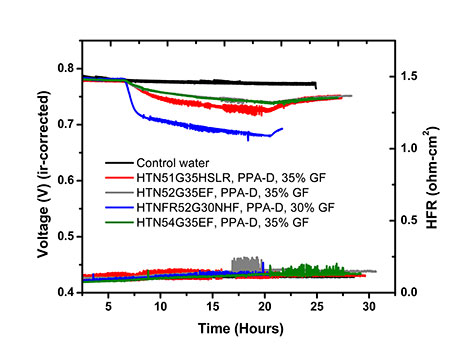
Effect of BOP Contaminants on Voltage Loss Standard Operation Conditions: Tcell=80 deg C, RH%=32/32, Stoich=2/2, Back pressure=150/150 kPa, i = 0.2 A/cm2 Graph of the effect of balance of plant (BOP) contaminants on voltage loss over time for each materials class. |
Notes:
| ||||||
Average Leaching Index [TOC + Conductivity]Data not available | Voltage Loss in Relation to Leaching IndexData not availableStandard Operation Conditions: Tcell=80 deg C, RH%=32/32, Stoich=2/2, Back pressure=150/150 kPa, i = 0.2 A/cm2 |
Share
Last Updated Feb. 13, 2025
