Quality Assessment with SERI QC
SERI QC is a quality assessment procedure for the three solar radiation data elements: global horizontal, diffuse horizontal, and direct normal.
After data are collected, quality assessment can indicate whether a data value is reasonable, too small, too large, or missing. It is not used to change data values and should not be confused with quality control and quality assurance. Quality control and quality assurance occur before and during data collection and include procedures such as the proper selection and installation of instruments and data acquisition equipment as well as regular maintenance and calibration. Quality assessment cannot replace quality control and quality assurance because it will not detect small changes caused by dirty or unleveled sensors or changes in calibration factors.
Quality assessment procedures for solar radiation data assign a flag ranging from 0 to 99 to each of the hourly data elements. To select data for analysis purposes, the flags may be used to screen the data files for data meeting user-defined acceptance criteria.
Quality Assessment for Solar Radiation Data
The three solar radiation data elements (global horizontal, diffuse horizontal, and direct normal) are quality-assessed using SERI QC, a procedural and software package developed by NLR. SERI QC defines ranges of acceptable data, depending on whether one, two, or all three hourly data elements are present. Ranges are defined based on dimensionless parameters normalized with respect to extraterrestrial radiation, where:
Kt = Clearness index or global horizontal transmittance
= Global horizontal radiation/extraterrestrial horizontal radiationKd = Diffuse horizontal transmittance
= Diffuse horizontal radiation/extraterrestrial horizontal radiationKn = Direct normal transmittance
= Direct normal radiation/extraterrestrial direct normal radiation.
Depending on the circumstances, SERI QC performs one-element, two-element, or three-element tests. First, it performs a one-element test by defining a range of acceptable values between minimum and maximum values of Kt, Kd, or Kn, depending on the element being tested, based on three air mass regimes and the month of the year.
Second, if the zenith angle (at the middle of the hour) is less than or equal to 80° and all three of the elements are present, SERI QC performs a three-element test by defining a range of acceptable values so that the equation Kt = Kd + Kn is satisfied within an arbitrary error limit of ± 0.03, which accounts for measurement uncertainties.
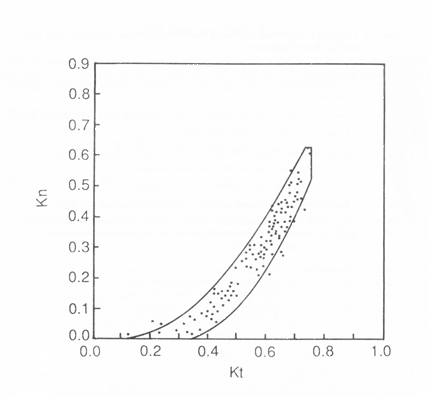
Third, if the data pass the three-element test (or only two elements passed the one-element test), SERI QC performs a two-element test by defining a range of acceptable values within boundaries such as those shown in the figure below.

SERI QC data boundaries for two-element quality assessment.
The boundaries in the figure are previously determined empirically for three different air mass regimes for each month using data collected at the site. In the figure, the direct normal transmittance is plotted against global horizontal transmittance. The lower boundary illustrates that with increasing cloud cover, direct normal radiation decreases more rapidly than global horizontal radiation. Consequently, data for cloudy skies are grouped toward the lower boundary. Clear sky data reside near the upper boundary.
For some seldom occurring conditions, data depicting real conditions may reside outside the boundaries and be flagged as bad data. For example, if the sun is near the edge of a cloud, some of the sun's rays can be reflected off the edge of the cloud and increase the global horizontal radiation and Kt without affecting the direct normal radiation and Kn. This shifts the data point to the right in the figure, and it may be to the right of the lower boundary if Kt is large enough.
Bad data can also be flagged good by SERI QC. For overcast sky conditions, SERI QC does not detect an improperly adjusted shadowband because Kn = 0 and Kt = Kd within its arbitrary error limit.
After all SERI QC tests are completed, flags are assigned to the data according to the convention listed in the table below.
| Flag | Description |
|---|---|
00 | Untested (raw data) |
01 | Passed one-component test; data fall within min-max limits of Kt, Kn, or Kd |
02 | Passed two-component test; data fall within 0.03 of the Gompertz boundaries |
03 | Passed three-component test; data come within ±0.03 of satisfying |
04 | Passed visual inspection; not usedby SERI_QC |
05 | Failed visual inspection; not used by SERI_QC |
06 | Value estimated; passes all pertinent SERI_QC test |
07 | Failed one-component test; lower than allowed minimum |
08 | Failed one-component test; higher than allowed maximum |
09 | Passed three-component test but failed two-component test by >0.05 |
10–93 | Failed two- or three-component tests in one of four ways. 0 Parameter too low by three-component test (Kt=Kn+Kd) |
94-97 | Data fall into a physically impossible region where Kn > Kt by K-space distances of |
98 | Not used |
99 | Missing data |
Publications
User's Manual for SERI_QC Software: Assessing the Quality of Solar Radiation Data, NLR Technical Report (1993)
Share
Last Updated Dec. 6, 2025
