
Model Applications
The Distributed Generation Market Demand (dGen™) model supports many types of analysis and can help answer a range of distributed energy resource (DER)-related questions.
The examples below demonstrate in detail the different types of analysis that the dGen model can support.
Load Forecasting and Integrated Resource Planning
Projecting how much DERs are adopted and where is a critical input for peak-load forecasting and integrated resource planning. For example, solar adoption forecasts are used to estimated future load. These forecasted loads are then used to identify an optimal set of resources to procure over the planning period. Erroneous assumptions about solar adoption have significant impacts on the resources that are procured, as well as the resulting operation of the utility system.
A recent study by the dGen team demonstrated that the costs of incorrectly forecasting rooftop solar capacity are high, with an average net present savings of $2.3 million/terawatt hour of utility sales. To learn more, see Estimating the Value of Improved Distributed Photovoltaic Adoption Forecasts for Utility Resource Planning.
For an example of a similar application at the state-level, see Projections of Distributed Photovoltaic Adoption in Kentucky through 2040.
Policy Analysis
The dGen model can be used to explore the sensitivity of various DERs to policy and market factors.
A 2016 NLR report leveraged the dGen model to study the potential impact of federal tax credits on the deployment of renewable generation technologies. To learn more, see Impacts of Federal Tax Credit Extensions on Renewable Deployment and Power Sector Emissions.
Projected Impact of 2016 Federal Income Tax Incentive Extensions on U.S. Renewable Energy Deployment (not DER Specific)


On the state-level, The Impacts of Changes to Nevada's Net Metering Policy on the Financial Performance and Adoption of Distributed Photovoltaics report used the dGen model to evaluate changes to Nevada's net energy metering tariffs for customers with distributed generation. The report assessed the impact of the new tariffs' design on a photovoltaic system's payback period and projected photovoltaic adoption under the new tariffs.
Locational Value of Distributed Energy Resources
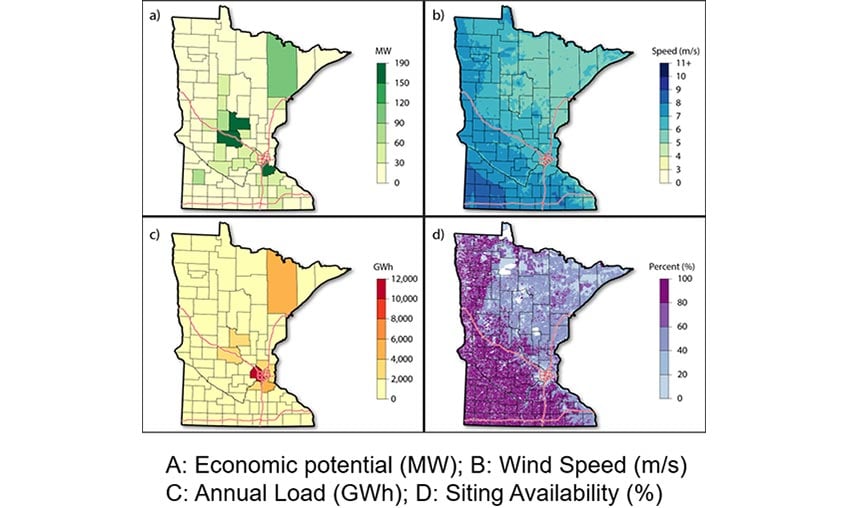
Using load, wind resource, and siting availability spatial layers, dGen identifies distributed wind economic potential in Minnesota.
All technologies modeled within the dGen framework leverage a database of highly resolved geospatial information and use an agent-based approach. Because each agent is assigned an actual location, it can be associated with several attributes from data sets in the underlying geospatial database using a simple spatial overlay.
The spatial layers include, but are not limited to, energy consumption profiles, census demographics, zoning and building counts, and renewable resource. The combination of these spatial layers allows dGen to identify the most promising sites and regions for DER deployment. In addition, the model can easily be trained on new sources of data and applied at multiple spatial resolutions—national, state, and even distribution-feeder level.
To learn more, see Assessment of the Economic Potential of Distributed Wind in Colorado, Minnesota, and New York.
Understanding the Role of Distributed Energy Resources in Future Energy Systems
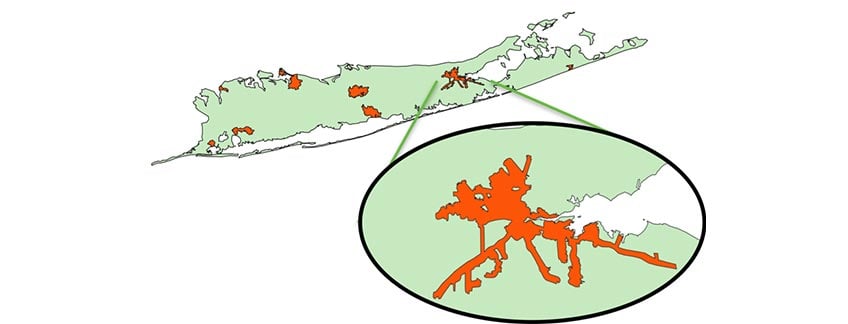
A Locational System Relief Value map for Long Island, New York. The New York Value of distributed energy resources framework credits generation based on locational value to the system.
Though DERs are likely to play a substantial role in the future energy system, there are many unresolved questions. The dGen model can be used to explore forward-looking topics, such as understanding:
- Infrastructure needs for distribution grids to accommodate DER deployment
- How DERs influence retail electricity prices
- The impact of an electrifying economy
- Synergy between distributed-scale resources and transmission-scale resources.
The dGen model operates in two modes specialized for different types of analysis:
- Aggregate Mode—Agents are statistically representative clusters of consumers. This mode needs less data and runs faster, but is less precise, making it better for large-area forecasts (e.g., state-wide analyses).
- Household Mode—Agents are modeling characteristics of actual buildings. This mode is more computationally complex and needs more data, but is more precise, making it better for small-area forecasts (e.g., a distribution network or city).
Share
Last Updated Jan. 28, 2026